


This is how Business Intelligence helps with your corporate strategy
Aligning the focus of all employees with clear key figures
A corporate strategy is designed to set a company up for success. But even the most brilliant strategy is doomed to fail if your employees do not understand how their daily work contributes to achieving your goals. Therefore, to properly align your team's focus, the strategy should be translated into clearly understandable and measurable metrics. Business intelligence can help you define the strategy, set the right metrics and check their status.
Use BI to develop your strategy
If you want to strengthen your competitive advantages with your strategy, you should first identify them. While many companies rely on gut feeling, you can also use facts to identify your strengths. If you combine market research results with historical data, for example, you can uncover trends and identify opportunities. This can help you come up with ideas for a new product, for example, or recognise that you should focus on a specific market. You can then set your business strategy accordingly.
Translate strategy into measurable goals
Once you have a strategy in place, the next challenge is to select the right metrics to measure its progress and break them down to individual departments or individual employees. Identifying the right metrics will determine what your business intelligence system will analyse and what it will show in dashboards. In this way, each employee should be able to see how he or she can contribute to achieving the defined goals. Therefore, you should determine which key figure should reach which target value. This target value should be challenging, but at the same time achievable, so that your employees are not demotivated by unrealistic or too low targets. To set an appropriate value, you can use historical data analysis and data forecasts from business intelligence tools.
How to find the right key figures
There are absolute metrics, such as profit, revenue, or scrap, and relative metrics that compare two values to each other, such as productivity, where you compare the outcome of a process to the effort expended on it. In addition, there are also qualitative metrics, which are often used in connection with sustainability issues. But not every possible metric is useful or effective for your strategy. The key performance indicators (KPIs) are the key metrics of your company that you track. While you can consider any figures you calculate regarding your company to be metrics, ideally, just a few carefully selected KPIs are sufficient to provide an overview of all business processes at a glance.
These five to ten KPIs are defined in alignment with your corporate strategy. The following points are important here:
- Is the indicator assessable, i.e. can values be defined that are either good or poor?
- Does the indicator correspond to the corporate strategy? You can determine whether a key figure makes sense for you by answering a few questions:
- What result is desired?
- Why is it important in the context of the corporate strategy?
- How is progress measured?
- How can the result be influenced?
- Who is responsible for it?
- How is it determined whether the goal has been achieved and how is progress monitored?
Example turnover: An increased turnover alone says nothing about the actual business success. It may be that the turnover increases, but at the same time the costs increase so much that the profit is negative. Therefore, if the business success is to be measured, it makes more sense to relate the turnover and the costs to each other in order to determine the profit (turnover - costs = profit). Conversely, an increase in profit does not necessarily mean that turnover has also increased, as it could be that costs have simply decreased. So if your business strategy is geared towards market growth, profit is not a useful metric.
- Is the data required for this clean? If KPIs are calculated from incomplete or incorrect data, the result will also be wrong.
- Are the KPIs clearly understandable? Everyone who uses the KPIs should understand exactly how they are calculated and what they mean. This avoids ambiguities and room for interpretation.
- How can a key figure be influenced? In order for every employee to know how they can contribute to the company's success, they should not only know the key figures, but also understand what they can do to influence them positively.
- What is done if the values do not develop as desired?
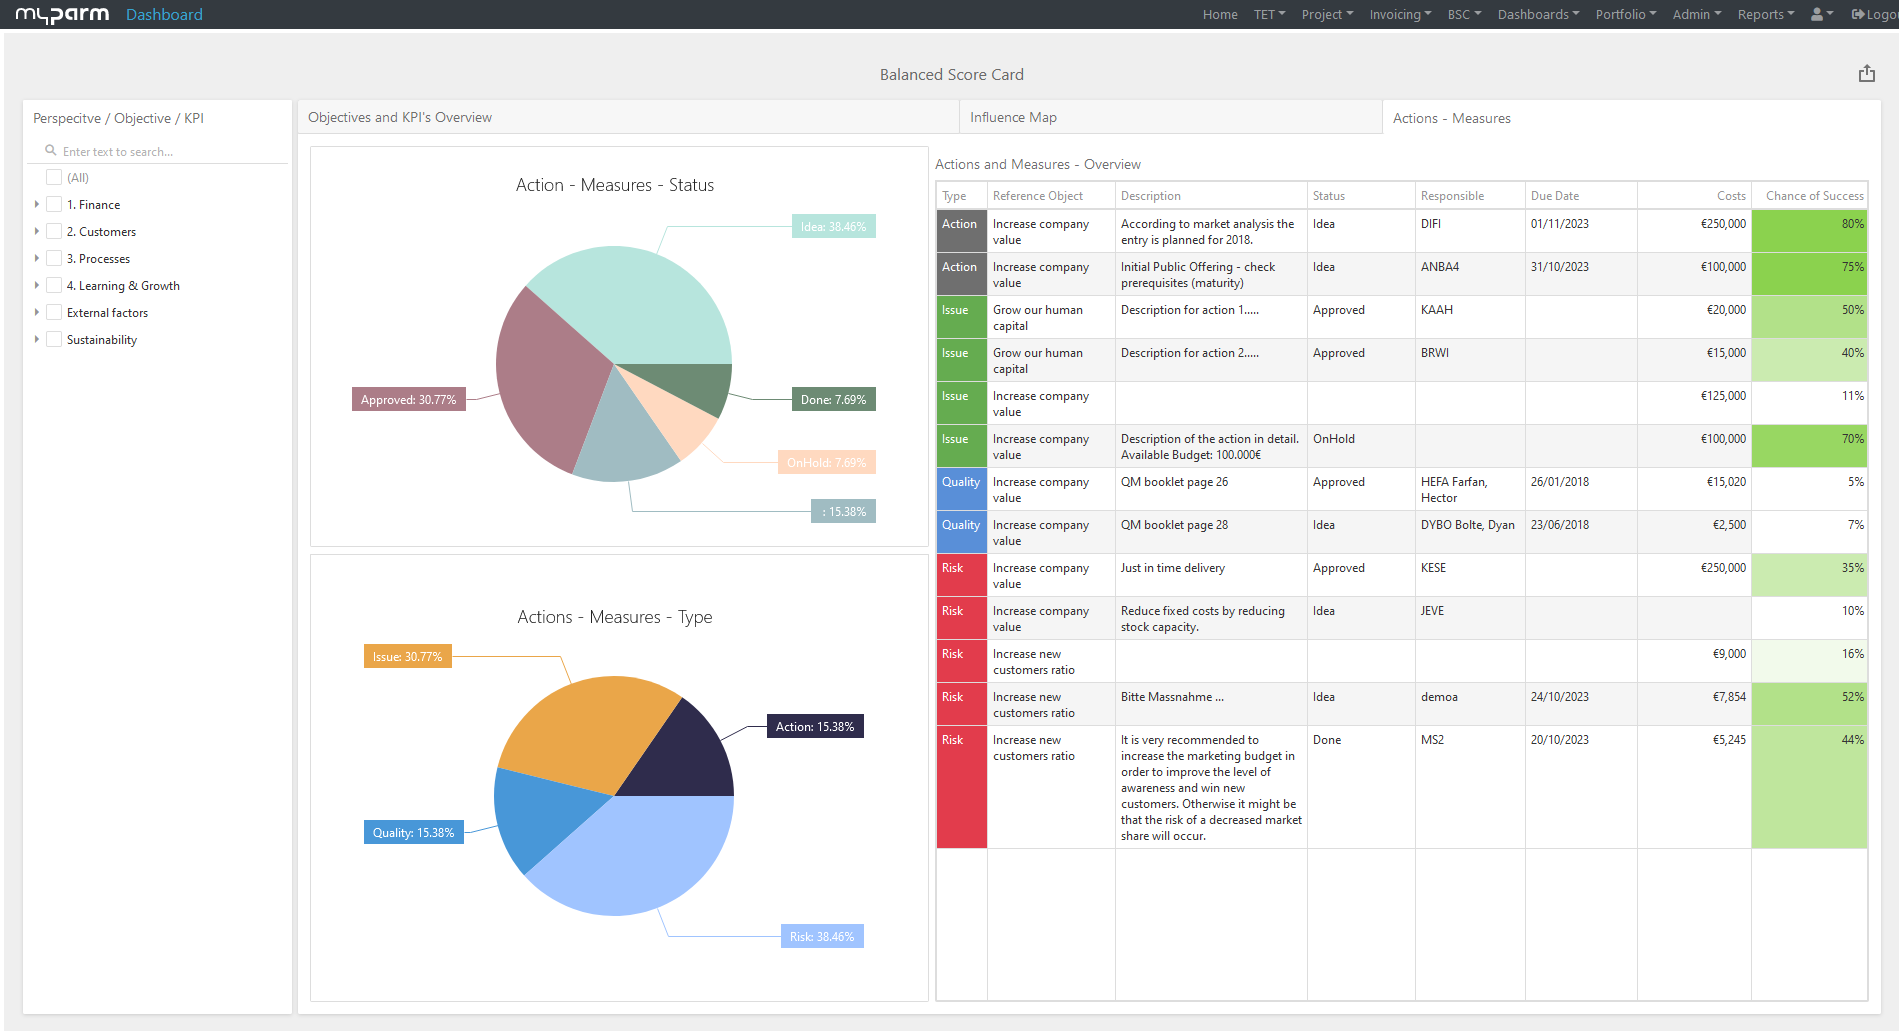
A Balanced Scorecard (BSC) makes your strategic goals and key figures visible in a simple way. This helps you to implement your corporate strategy and to check the current implementation status at any time.
Examples of key performance indicators
For each business area, there are countless KPIs you can track that represent the pursuit of your business strategy in different ways. Here is an overview of some of the most important KPIs in different business areas:
1. Financial Ratios
A look at your cash flow, balance sheet, and income statement will show you whether your business is financially healthy. Your liquidity indicates whether you can cover your company’s needs with your available cash, helping you determine, for example, whether you can finance planned business growth. For example, by comparing your revenue to your profit, you can use the return on sales to verify whether your company is growing as planned.
2. Marketing Metrics
Marketing metrics provide insight into whether your marketing campaigns are achieving the desired results. These include, for example, the conversion rate, which shows how well a marketing campaign resonates with the target audience. Customer acquisition costs, on the other hand, show you the ratio of the marketing budget spent on acquiring a new customer to the revenue generated by that customer.
3. Sales Metrics
The sales ratio indicates how much money you invest in sales and how that compares to the revenue generated. The cancellation rate shows how many orders were canceled, while the close rate shows how many orders resulted from quotes issued. You can also measure metrics such as the complaint rate, which indicates how satisfied your customers are with your products.
4. Project Management Metrics
If your projects are completed on time and stay within budget, these are already important indicators that your project management is working very well. However, if you want to see whether project management performance has improved and how the projects have contributed to fulfilling your corporate strategy, you’ll need other metrics. Productivity, for example, shows you how effectively the resources at your disposal have been utilized. Return on investment (ROI), on the other hand, indicates how worthwhile a project has been for your company, as it allows you to see how much profit your investments in the project have generated.
5. Key Performance Indicators in Production
In addition to easily calculable metrics such as production volume, production downtime, production costs, and production time, you can also calculate, for example, equipment effectiveness, which takes into account the factors of equipment availability, performance, and quality. Key performance indicators such as the return rate provide insight into the quality of your production. You can also track unit costs over time, for example.
6. HR Metrics
These metrics provide insight into how your employees contribute to the health of your company, whether you are able to retain top talent, how attractive your company is as an employer, and how satisfied your employees are. In addition, the performance and productivity of your HR team can be analyzed so that you know which processes and strategies are effective. For example, the cost per hire is a simple measure of how much you’ve spent on recruiting and hiring a new employee. If you divide your profit by the number of employees, you get the net profit per employee. This figure gives you an idea of how efficient and productive your employees are. You can improve this figure by investing in new technologies that streamline work or by training employees—for example, in time-management methods such as the Pomodoro Technique—so they can perform better.
Monitor the progress of key figures with BI
Once you have defined the right metrics and goals, you should break them down to the individual departments or employees. Think carefully about how each department can contribute to achieving your goals. For example, if your goal is to maximize profits, the production department can contribute by increasing productivity or restructuring production processes to reduce manufacturing costs. Purchasing, on the other hand, could contribute to this goal by finding more cost-effective suppliers for raw materials, thereby reducing costs that would otherwise eat into profits, while sales could increase the closing rate. Here, too, business intelligence can provide you with valuable insights into the right key metrics, as it allows you to quickly identify areas with potential for improvement.
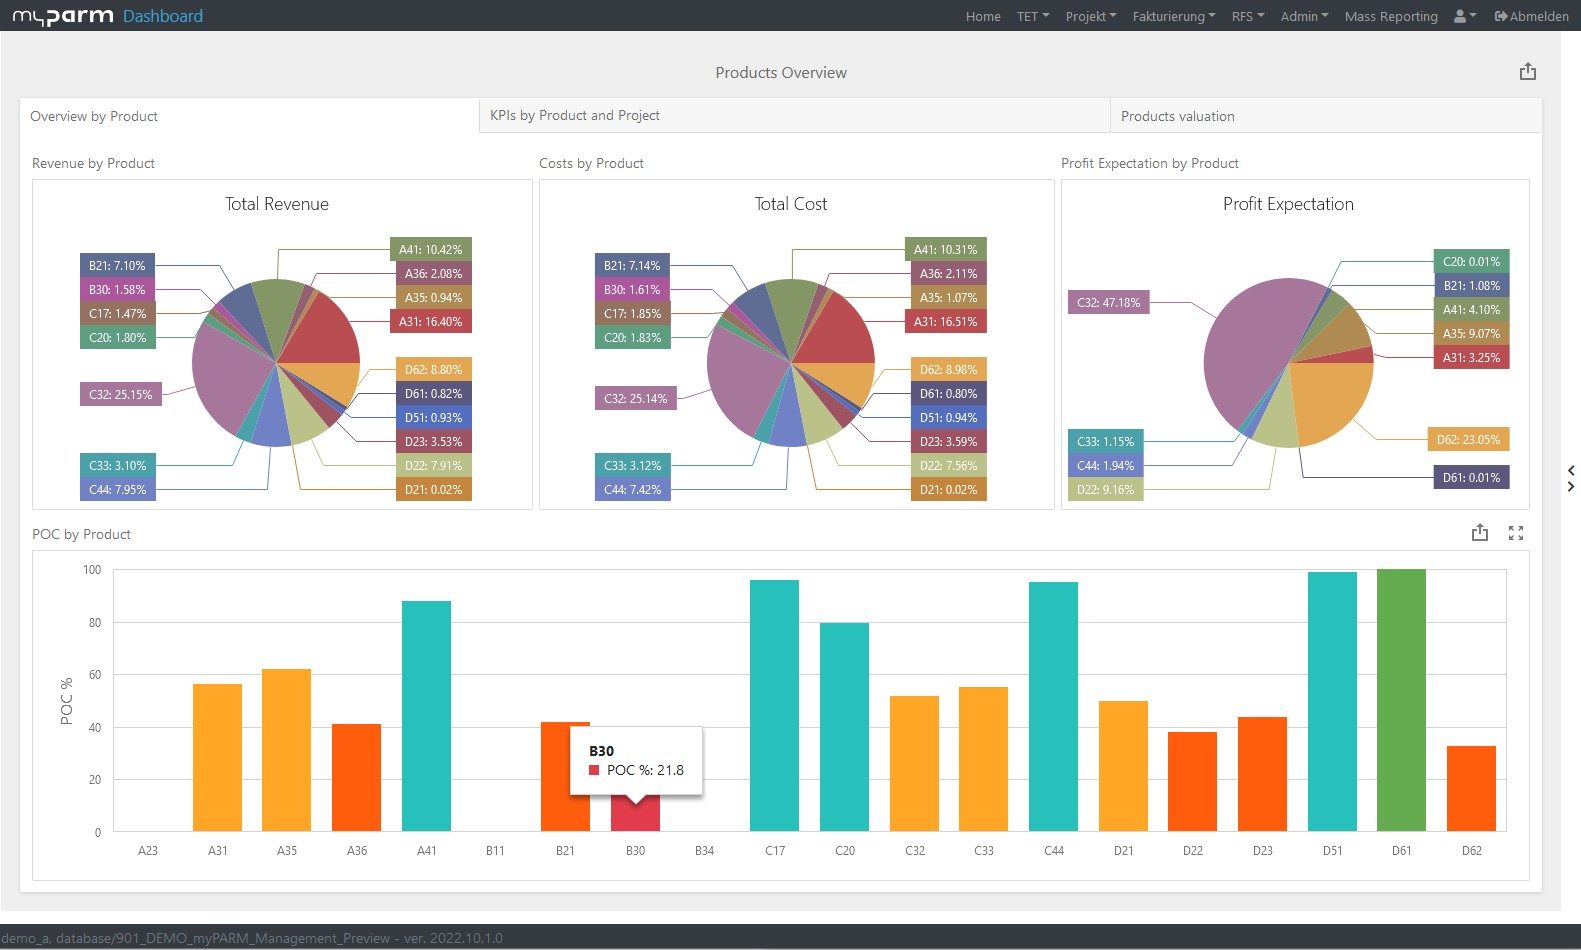
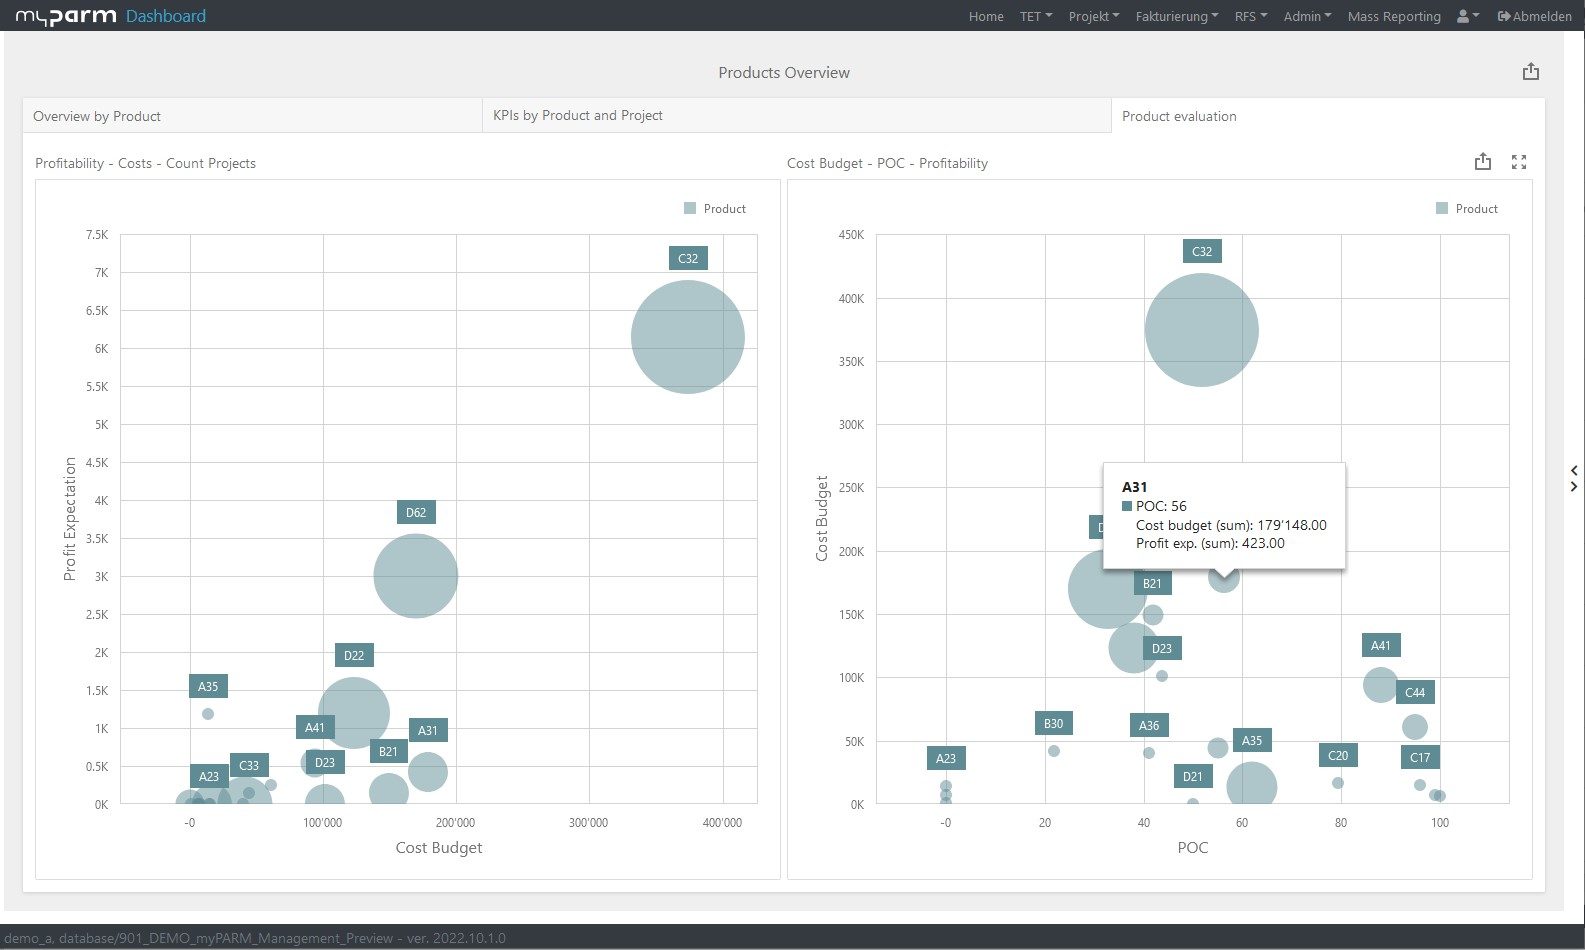
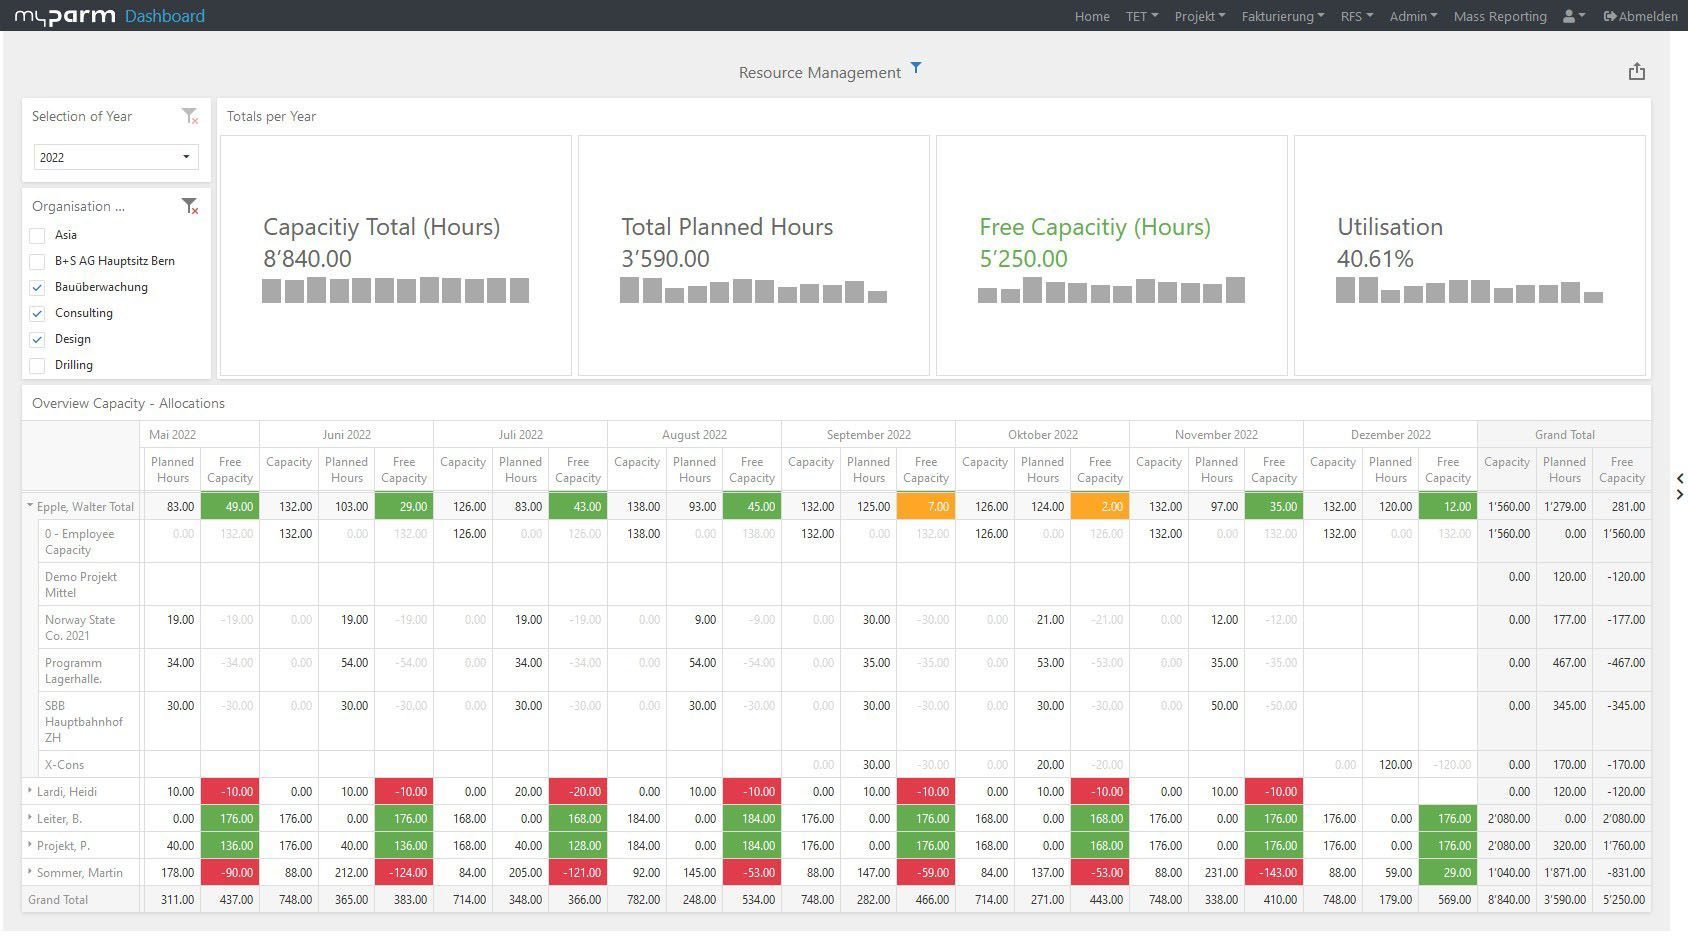
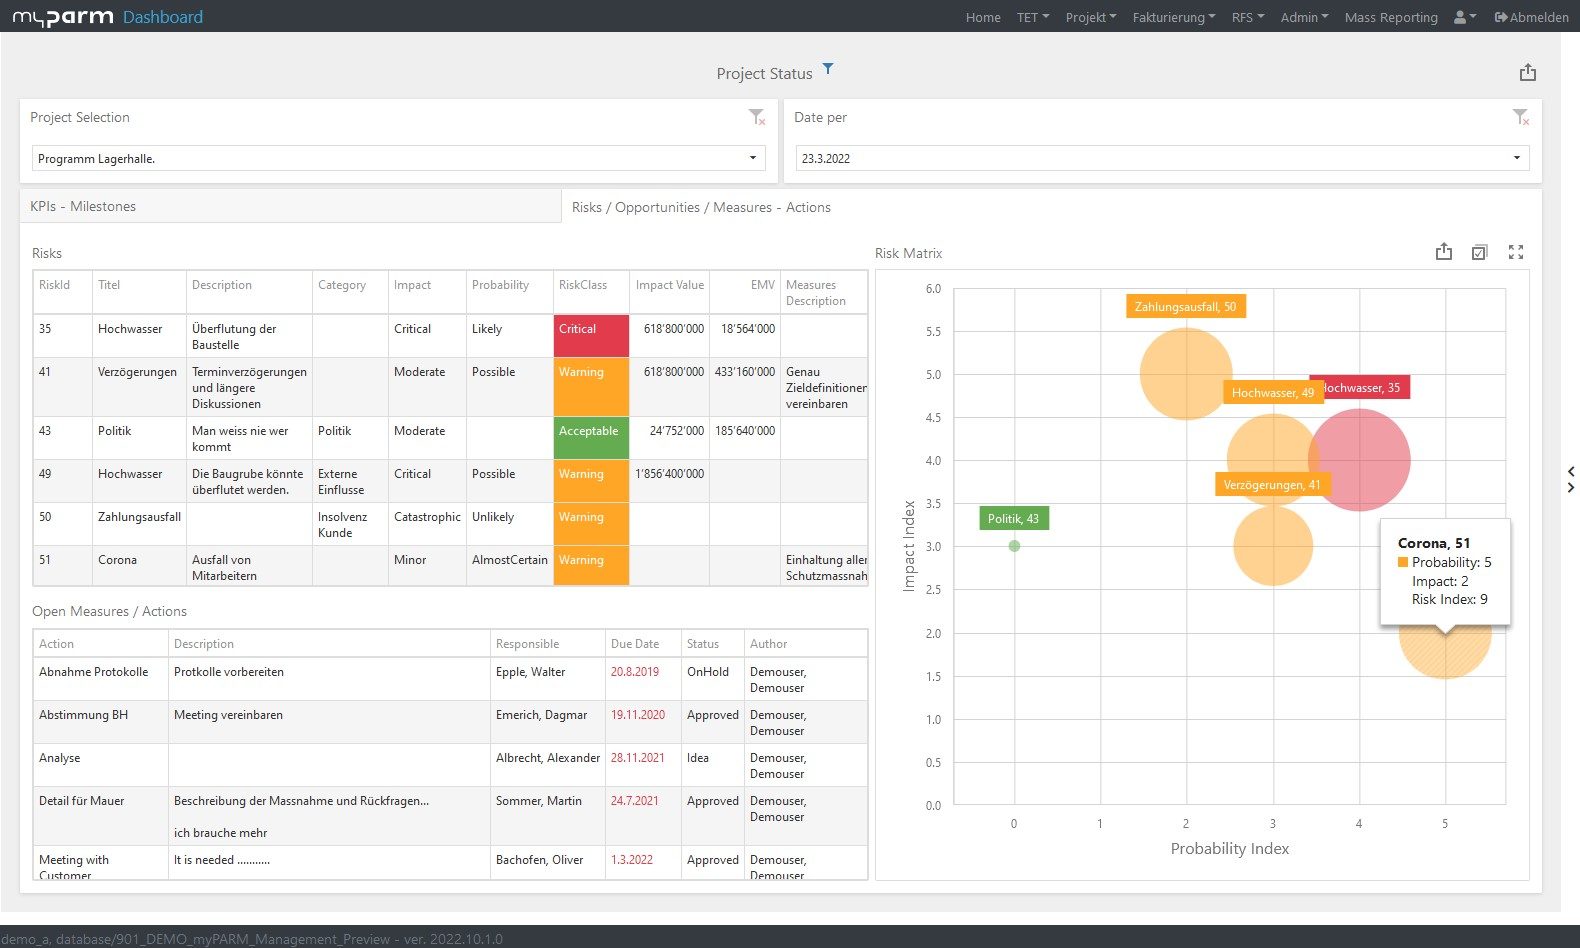
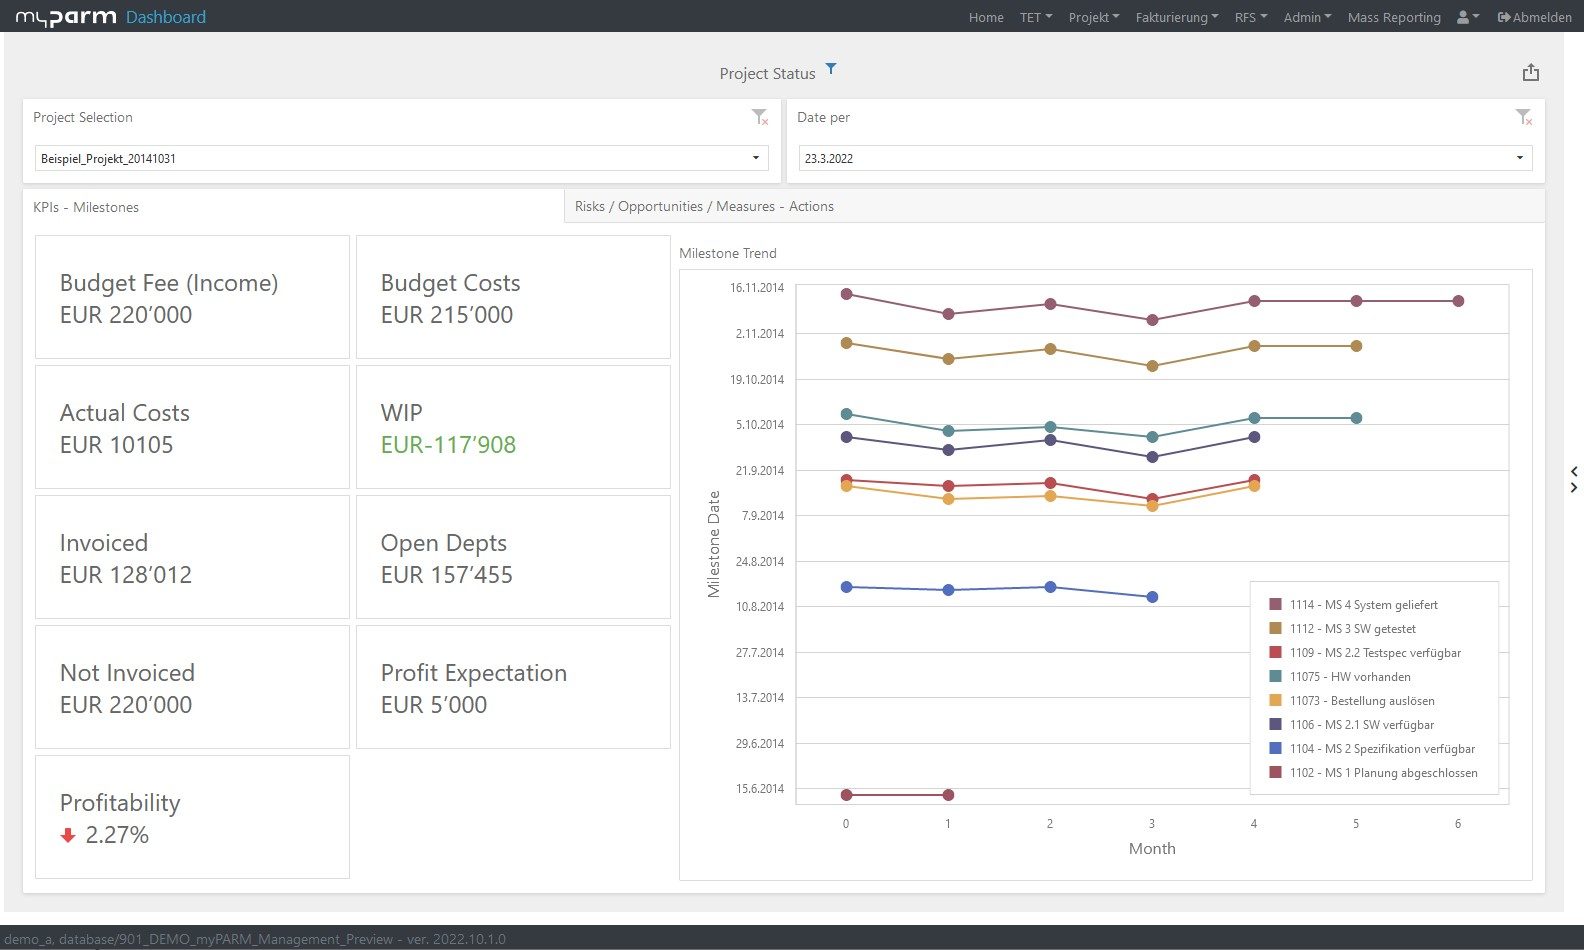
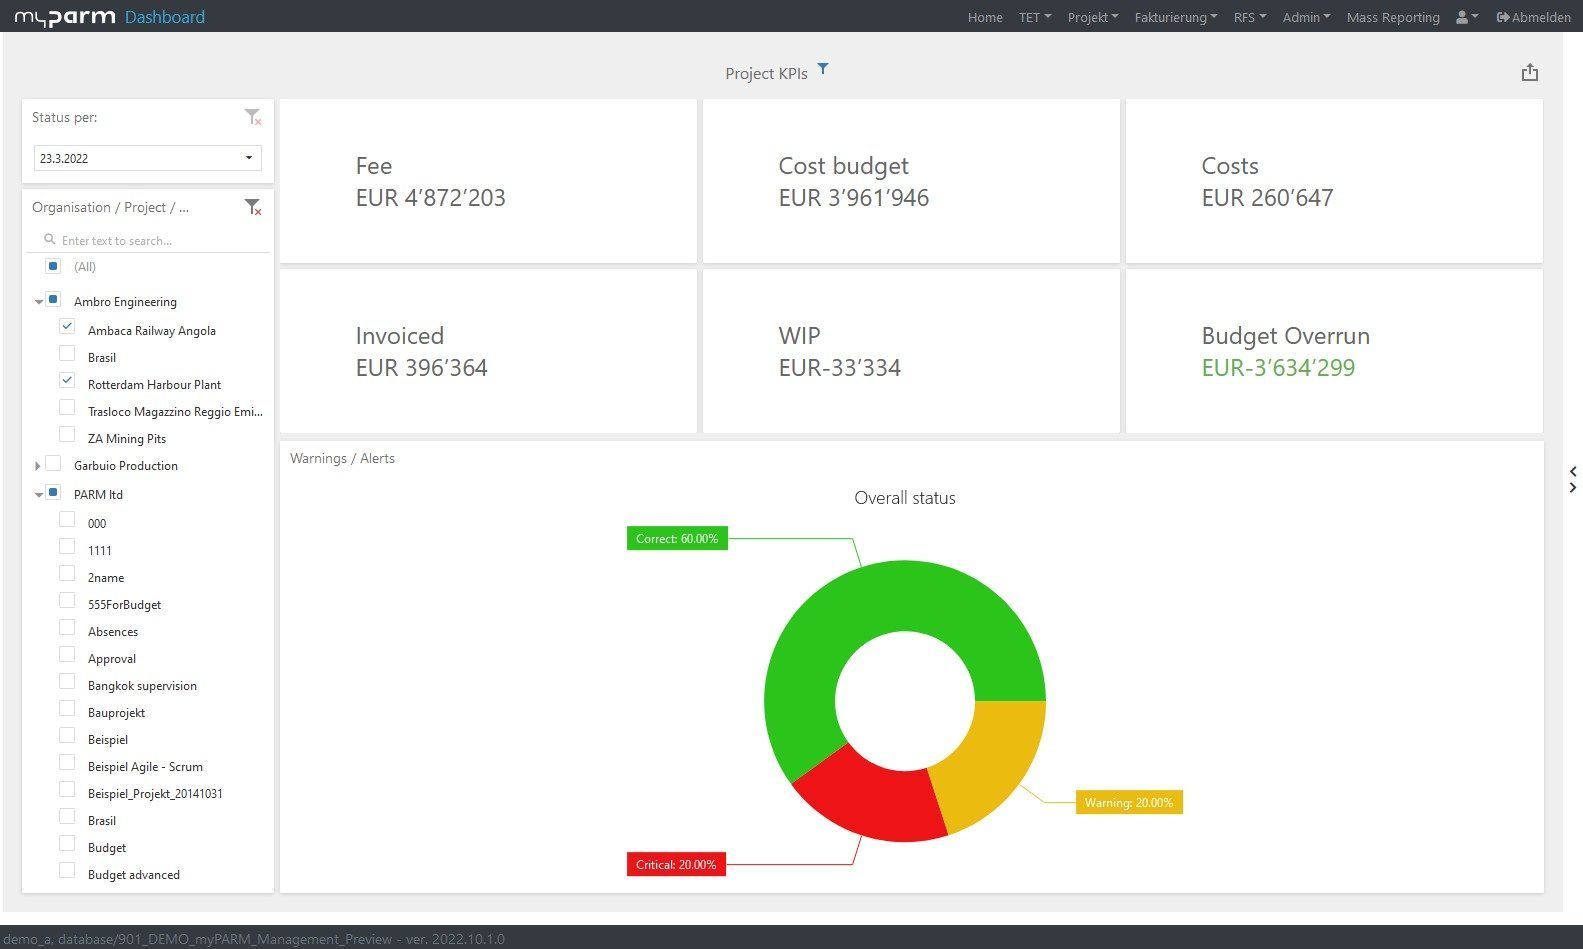
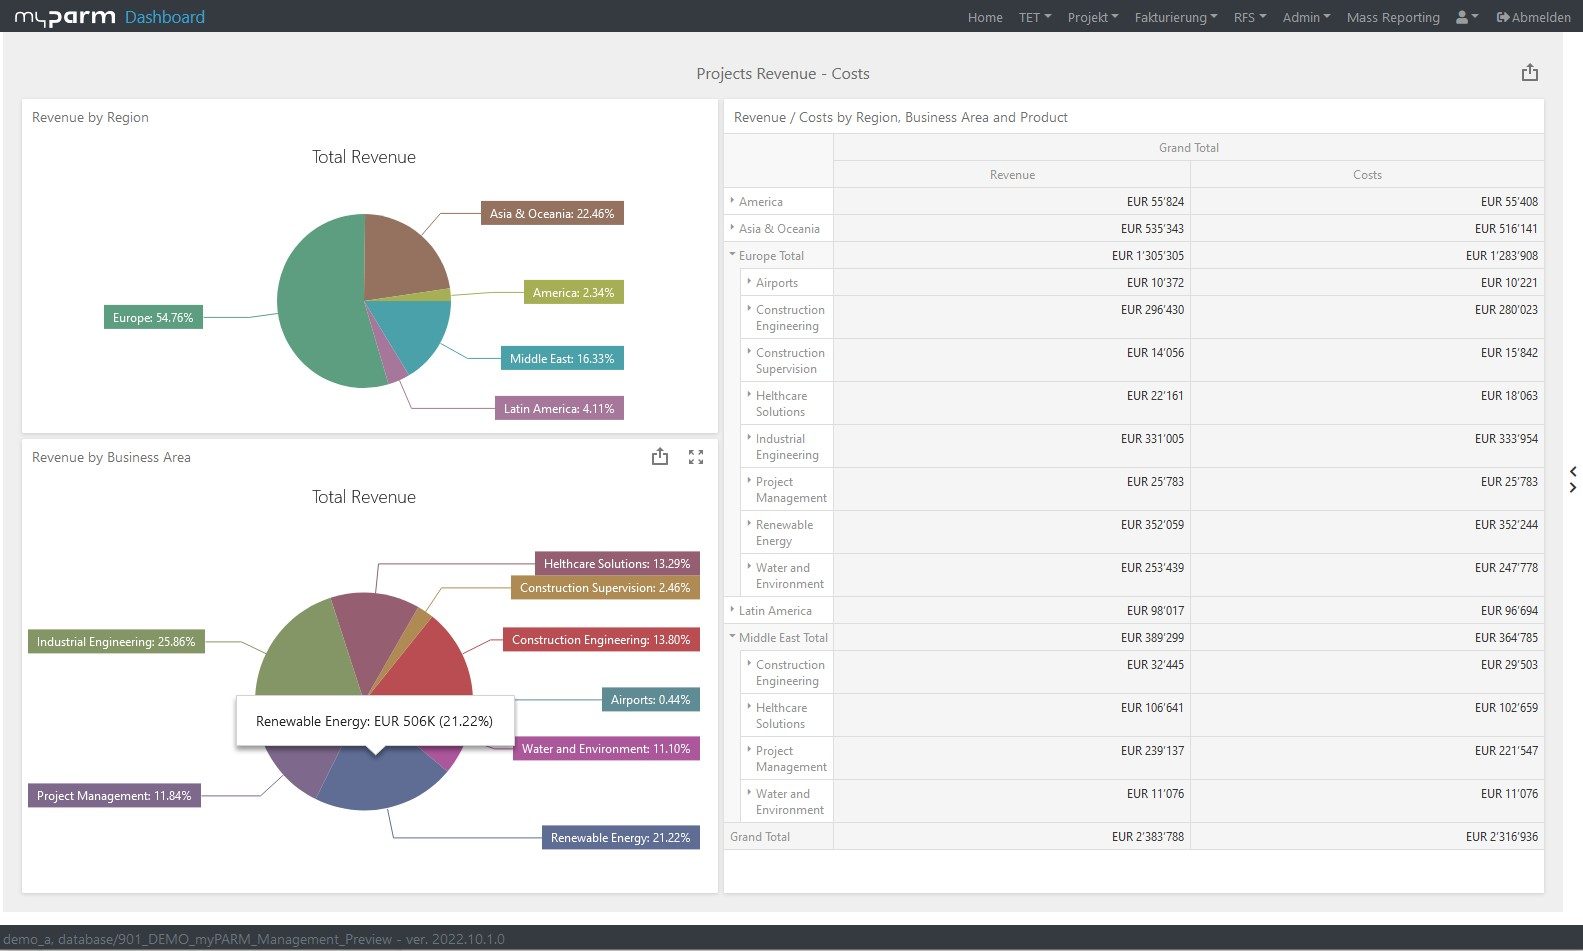
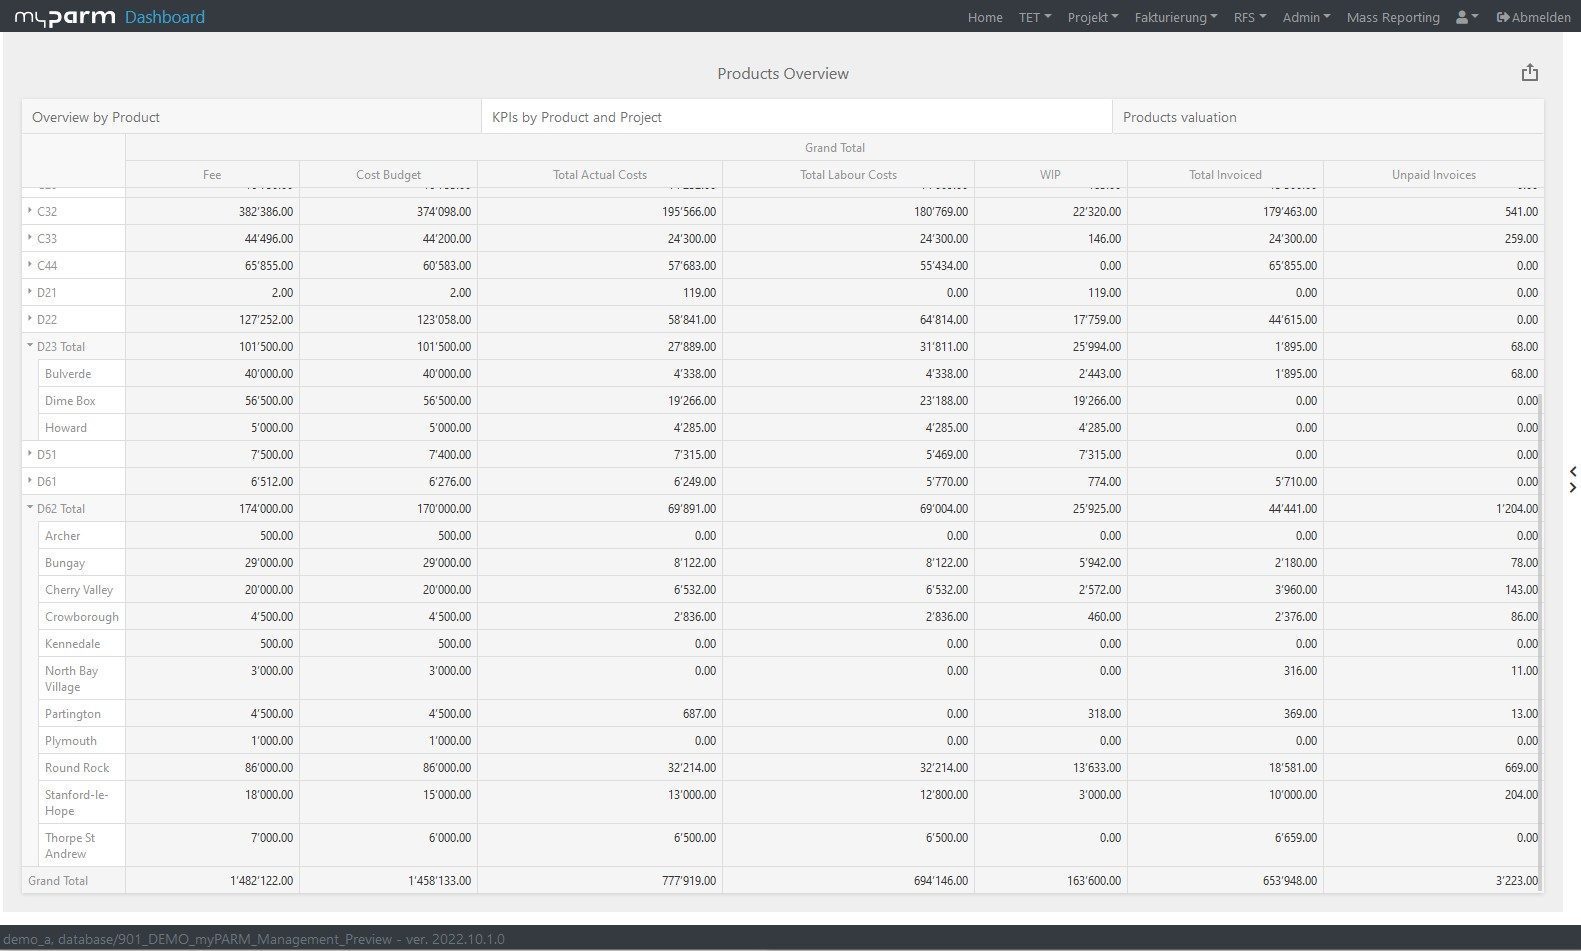
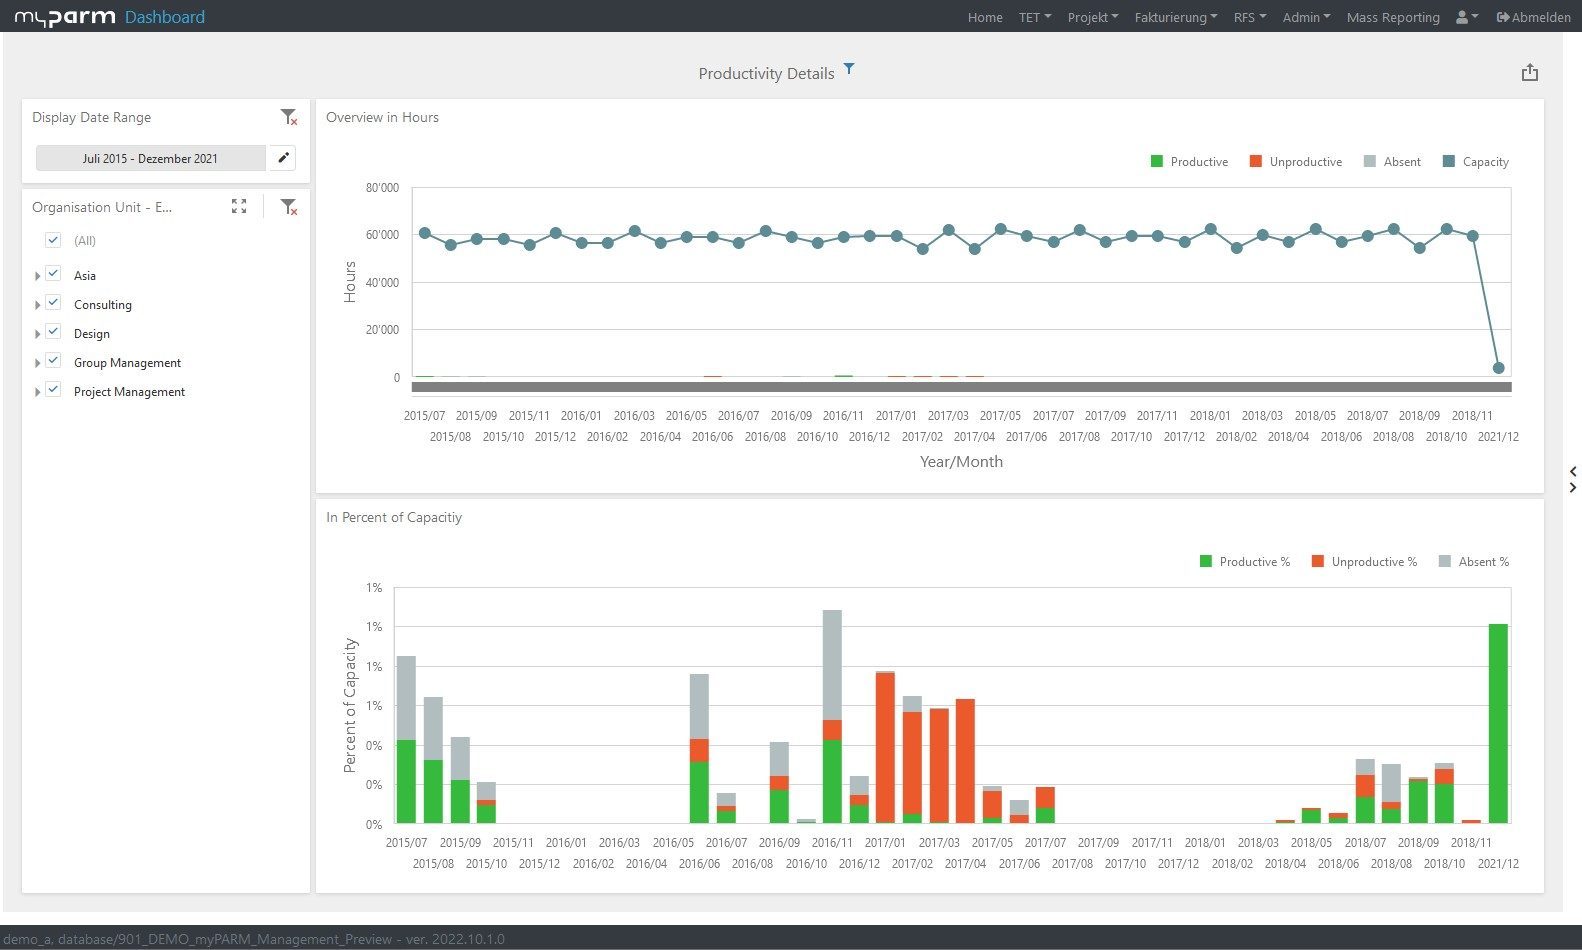
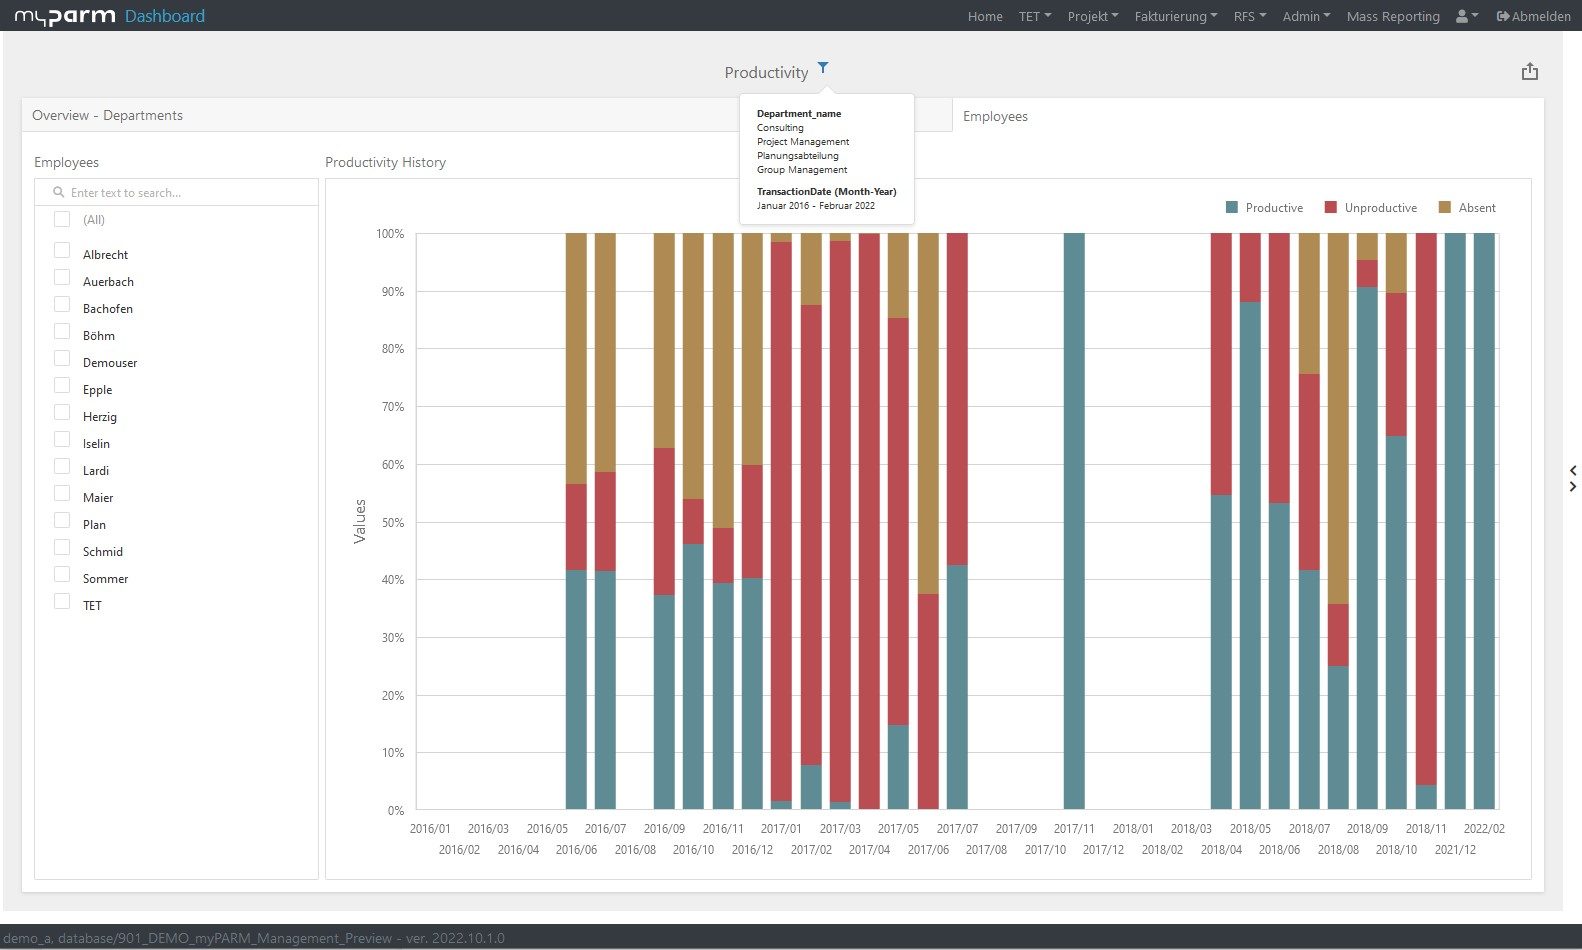
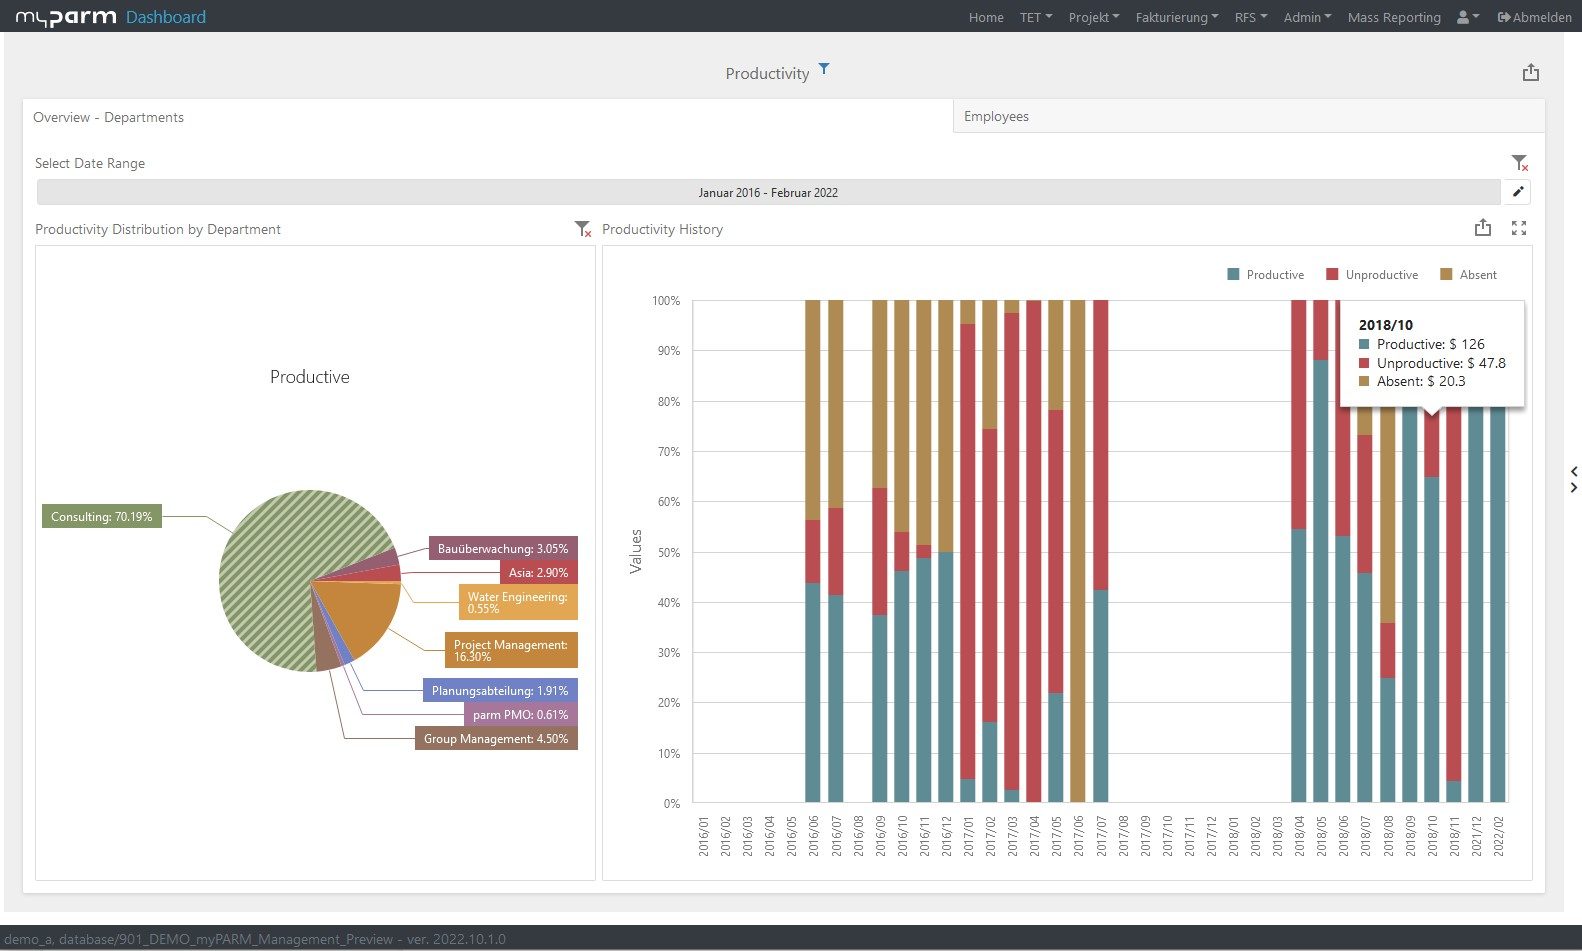
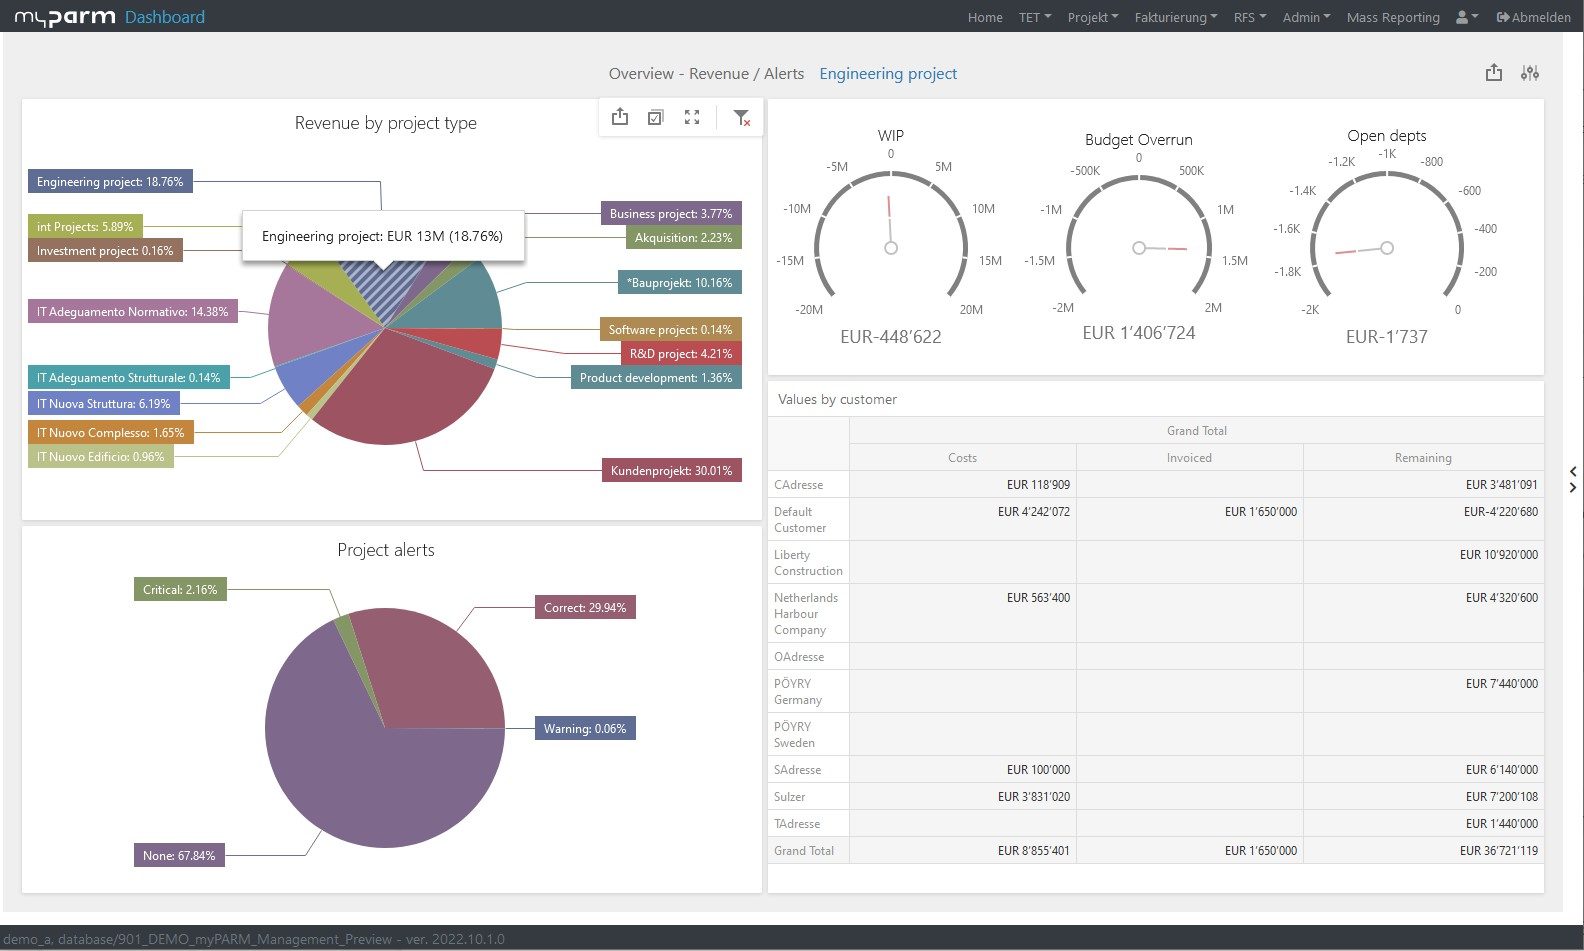
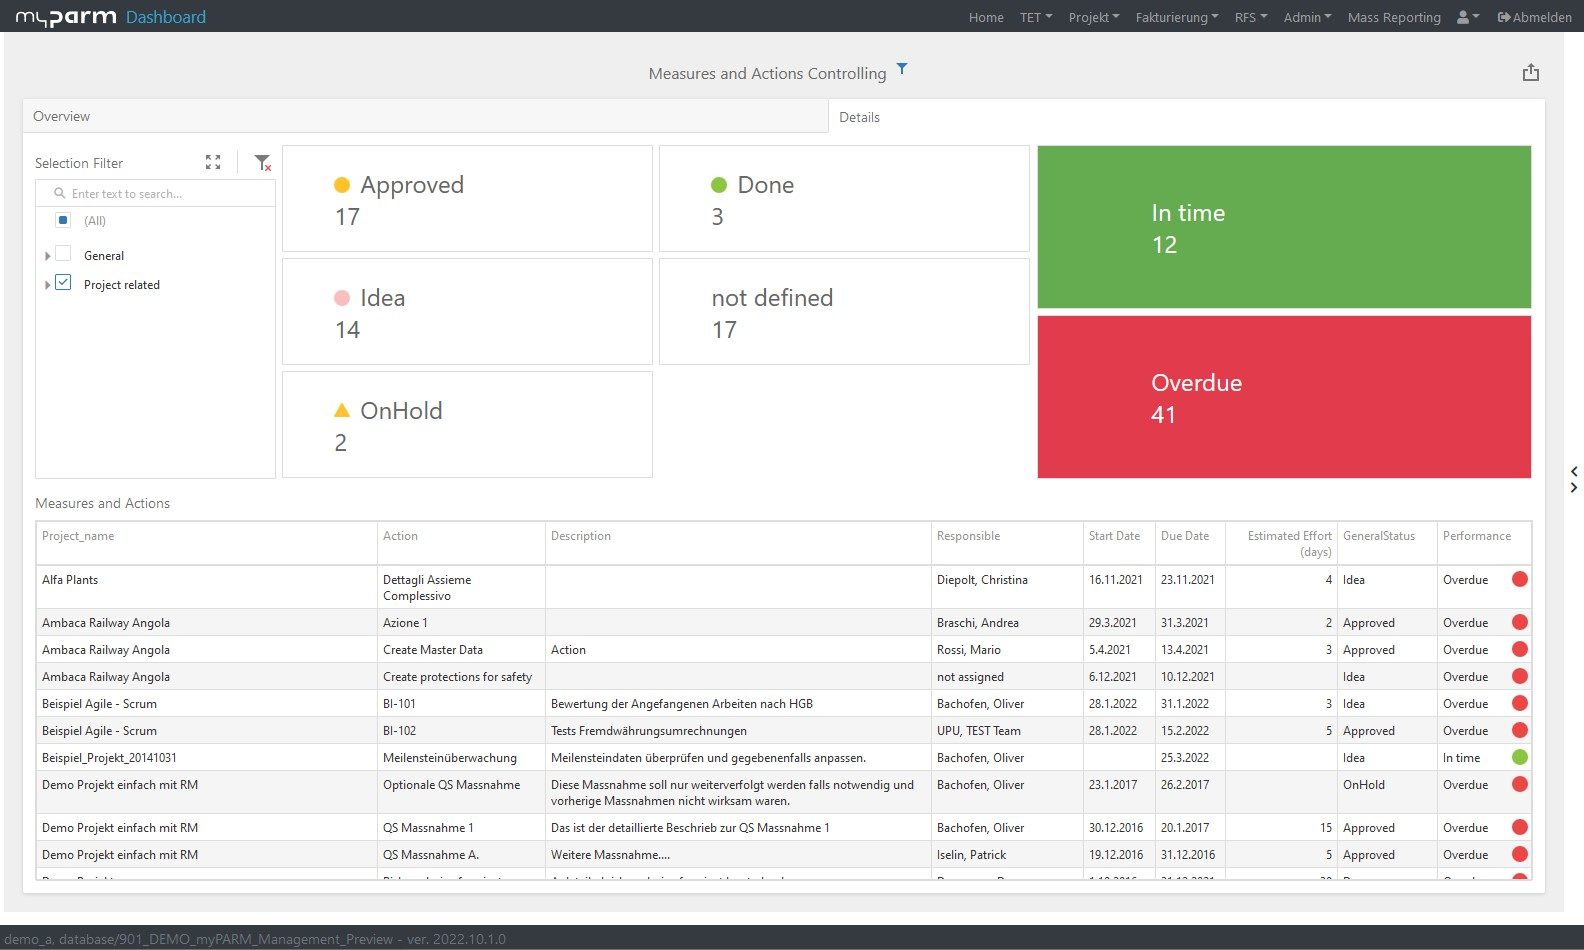
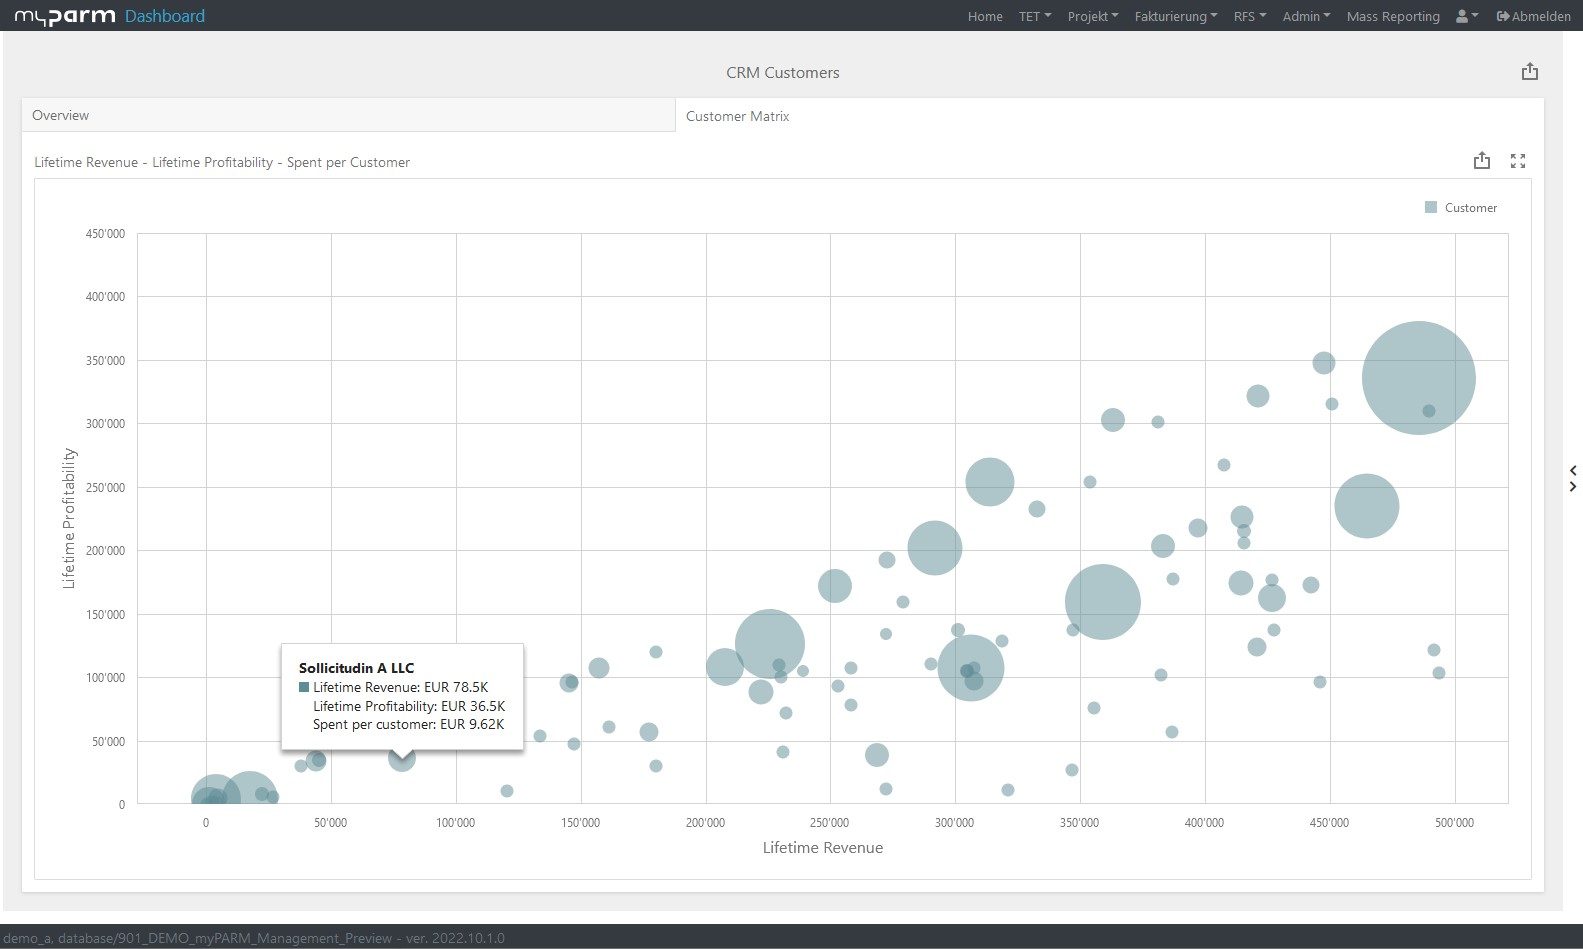
Reports and dashboards tailored to specific goals help you continuously monitor progress toward achieving them and assess how far your company has advanced in implementing the strategy. This gives every department the ability to review its individual progress at any time. BI software with flexibly customizable dashboards can help with this—it displays exactly the analyses that are relevant to each department, manager, and employee, and visually presents KPIs, for example, in comparison with their historical trends.

Conclusion
A solid business strategy is essential to ensure that all employees in your company are working toward the same goals. With the right, customized metrics, you can support the achievement of these goals and track progress using customized dashboards in your BI tool.
Good BI software not only helps you define the right corporate strategy and translate it into measurable goals, but also consolidates all key data so you can always keep an eye on the relevant metrics according to your needs. An integrated Balanced Scorecard is ideal for mapping the corporate strategy within the software and for later status reviews. Ideally, BI software also allows you to create and monitor actions for achieving goals right within the same system. With integrated task management, tasks can be assigned to your team, allowing you to steer the actions aligned with your corporate strategy. At the same time, this allows you to monitor the status of tasks, adjust the actions as needed, and communicate with your team through the system. This also enables the implementation of a policy deployment method such as Hoshin Kanri in our system.
Learn more about the Business Intelligence Software Software myPARM BIact:
Would you like to get to know myPARM BIact in a demo presentation? Then make an appointment with us right away!