


analysis and visualization
Forecasts, risks and opportunities
Answer your individual questions
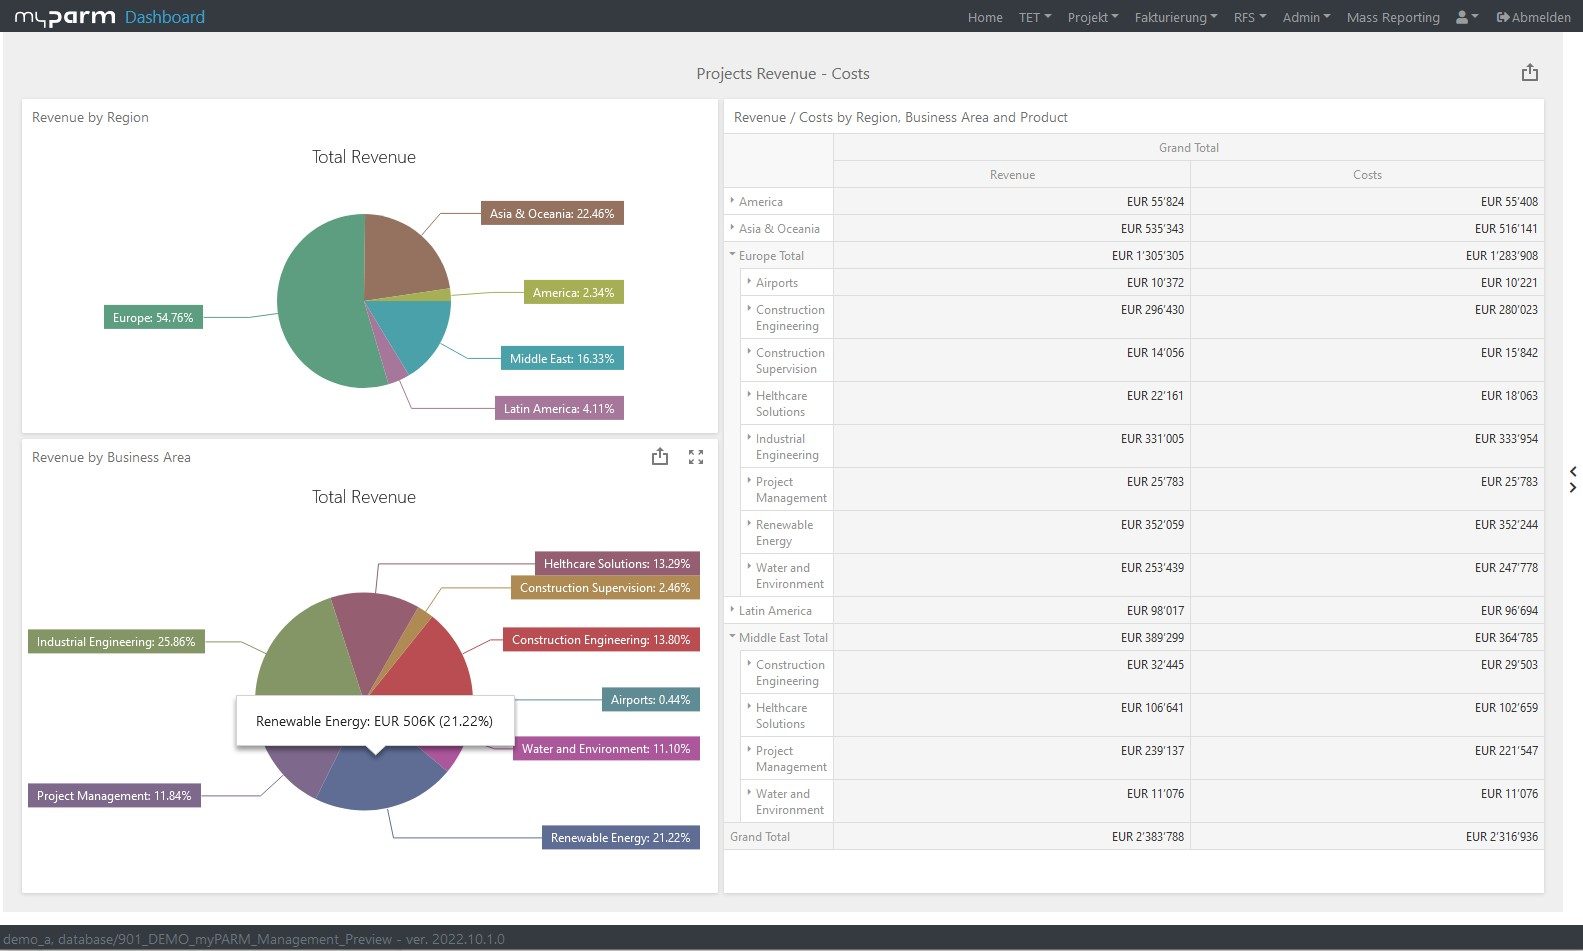
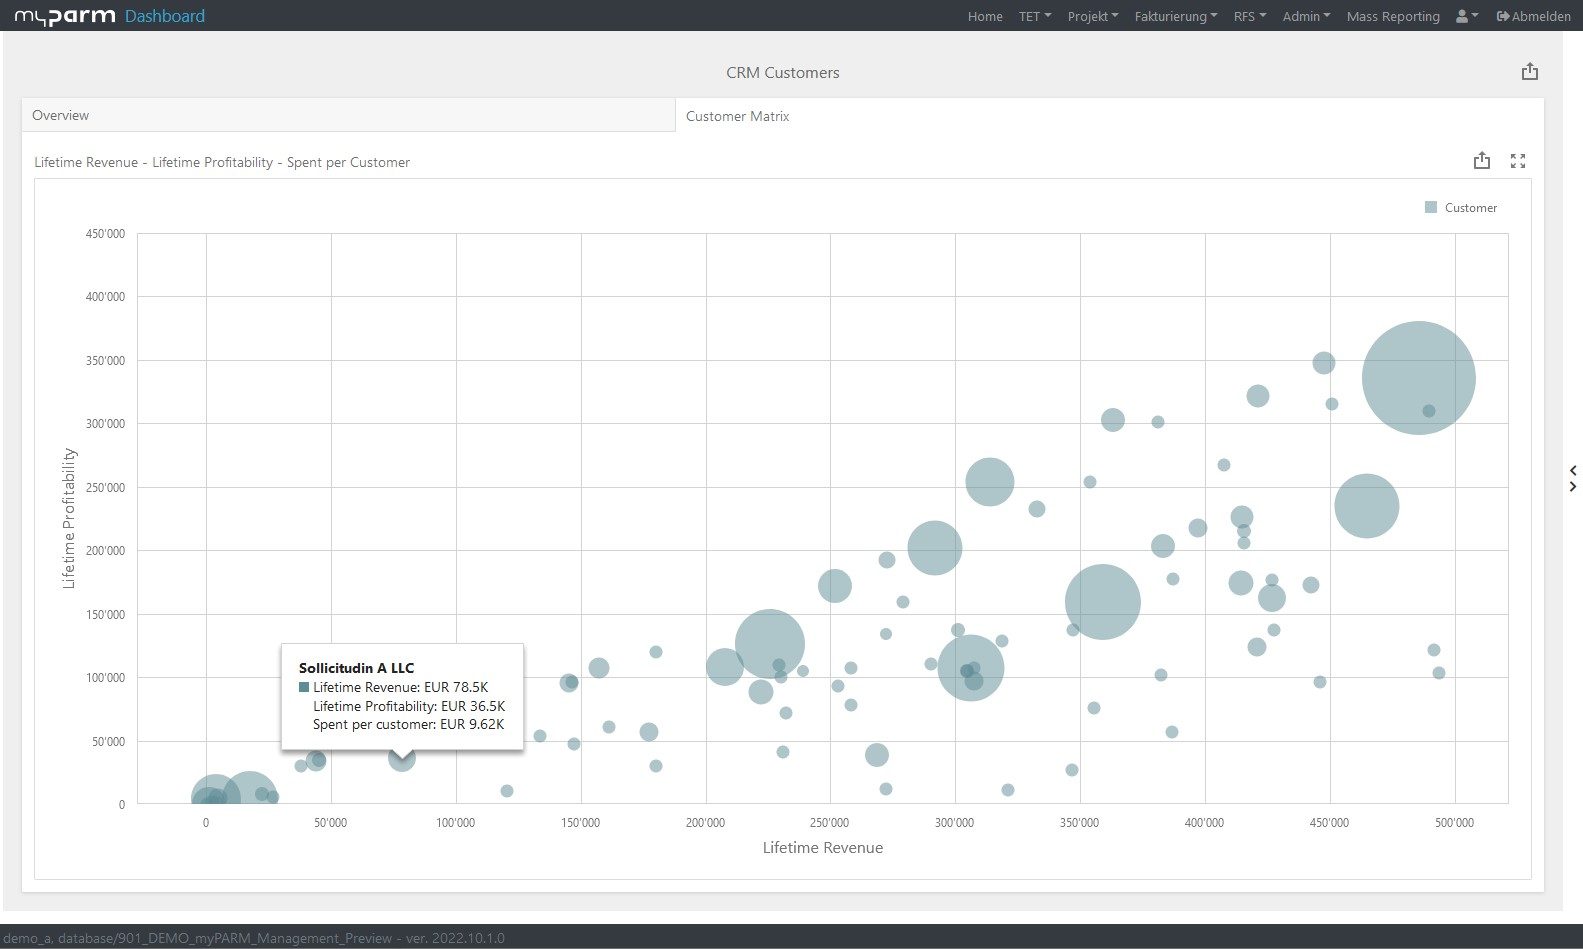
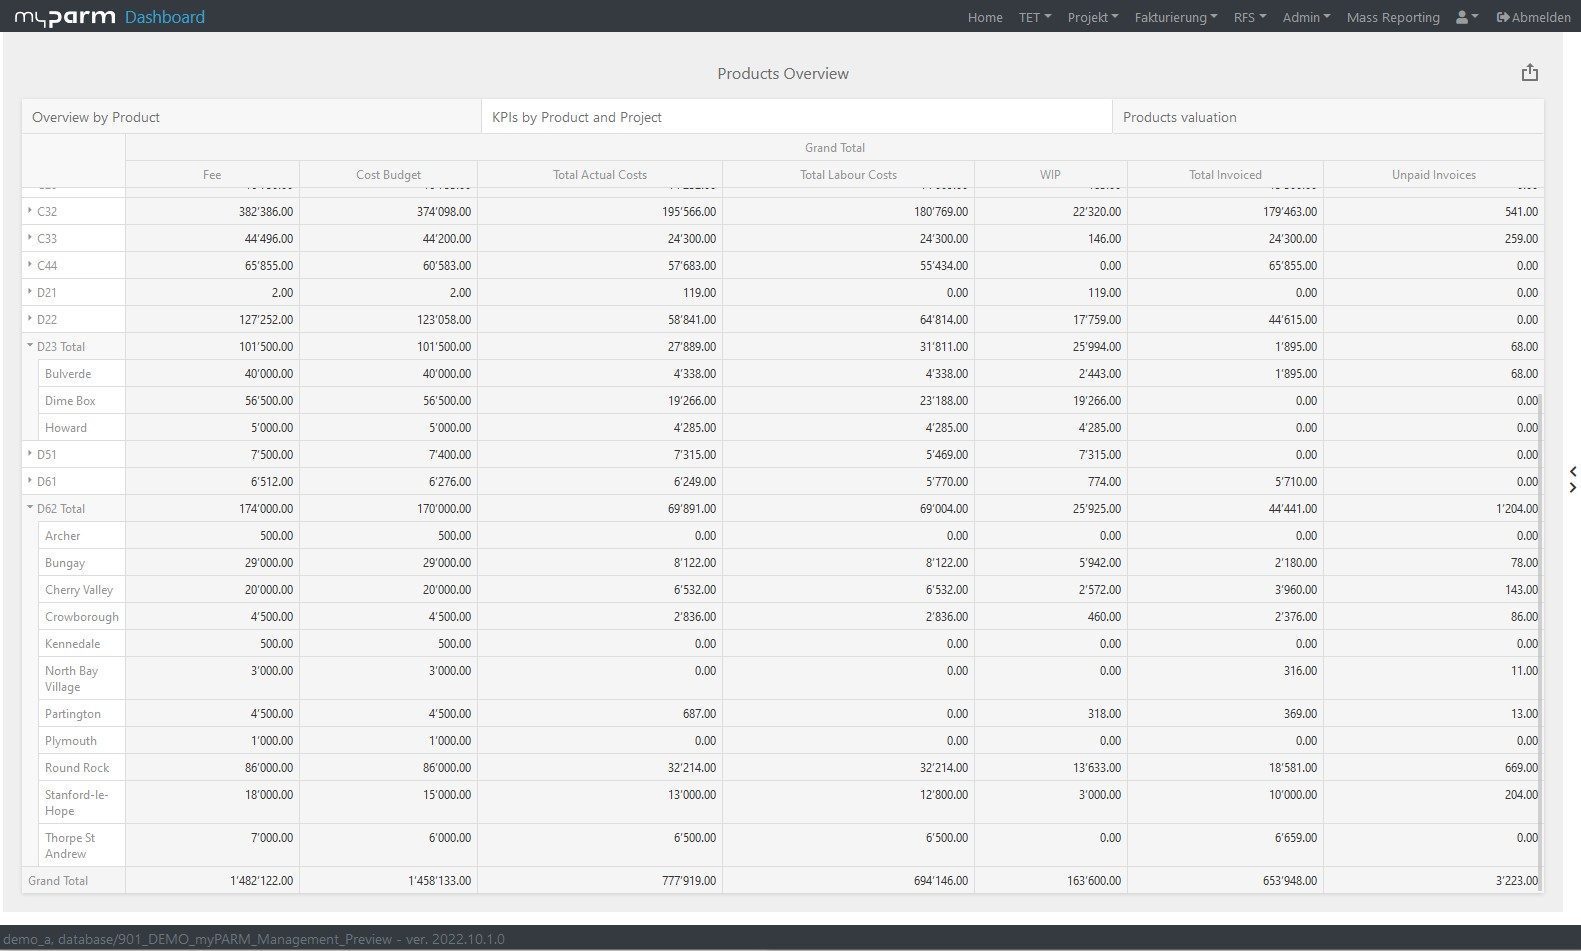
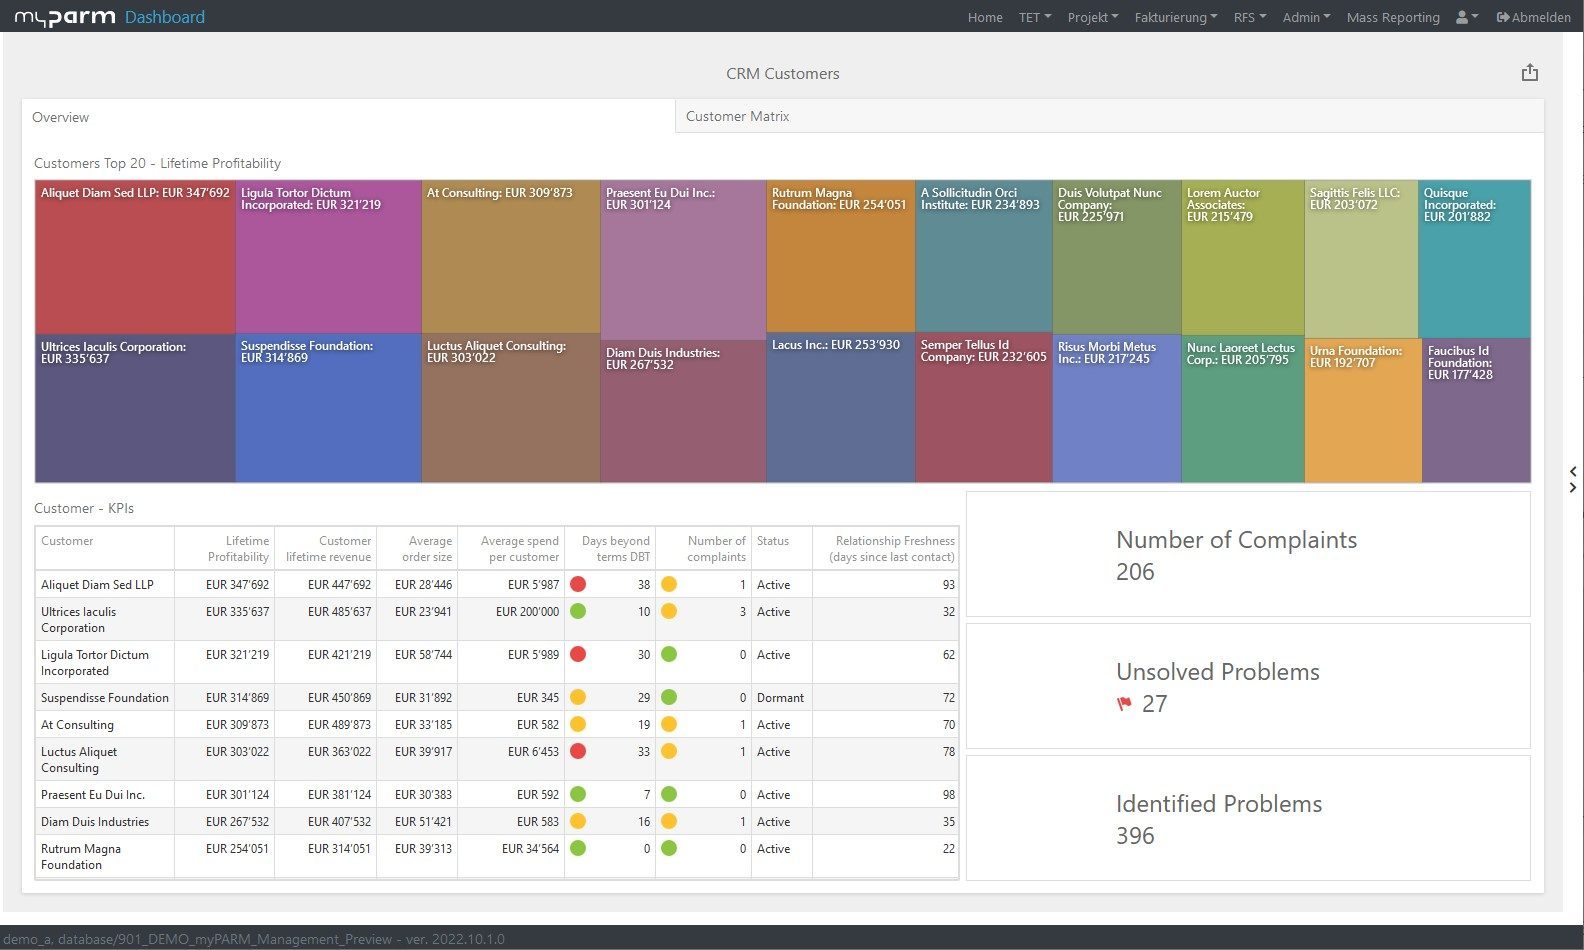
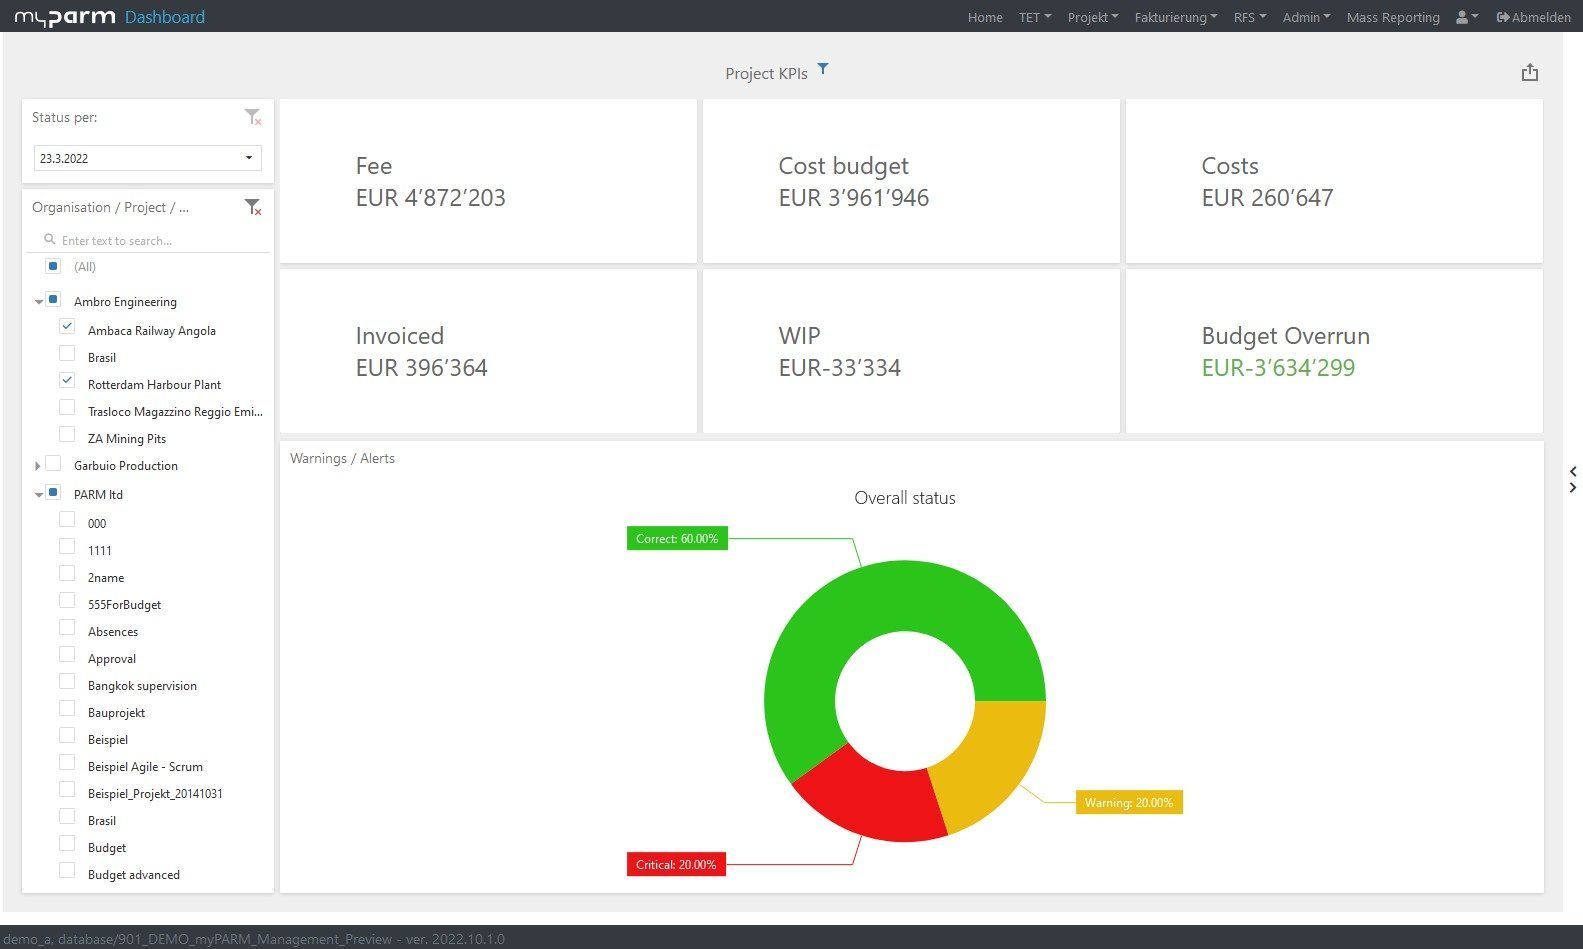
Evaluations, analyzes and forecasts in interactive dashboards
Extensive options for visualising the data
Powerful analytical tools for optimal decisions

Diverse analyses,
intelligent forecasts
Create ad-hoc reports or adapt standard reports to your needs and questions. At the push of a button, you receive all relevant data for your decisions. In addition, you are informed by the early warning system if unforeseen events occur or limit values are exceeded.
The powerful analysis tools enable you to make optimum plans and decisions. In addition, they show you important trends and what-if analyses. The integrated risk & opportunity management supports you in the analysis and enables you to implement appropriate strategies and measures.
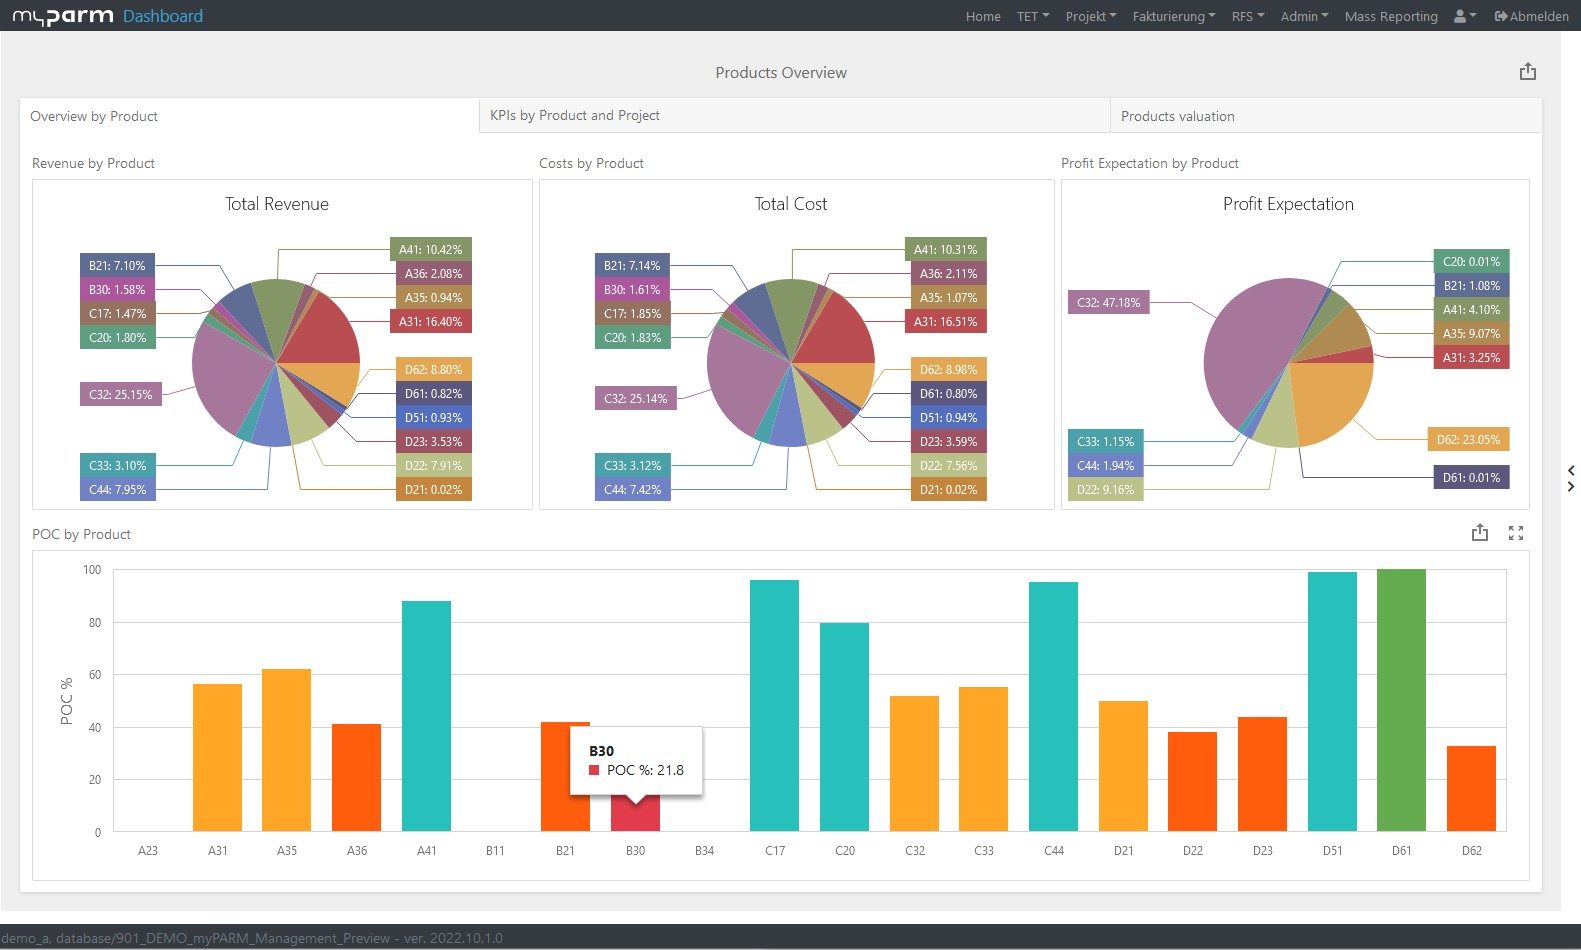
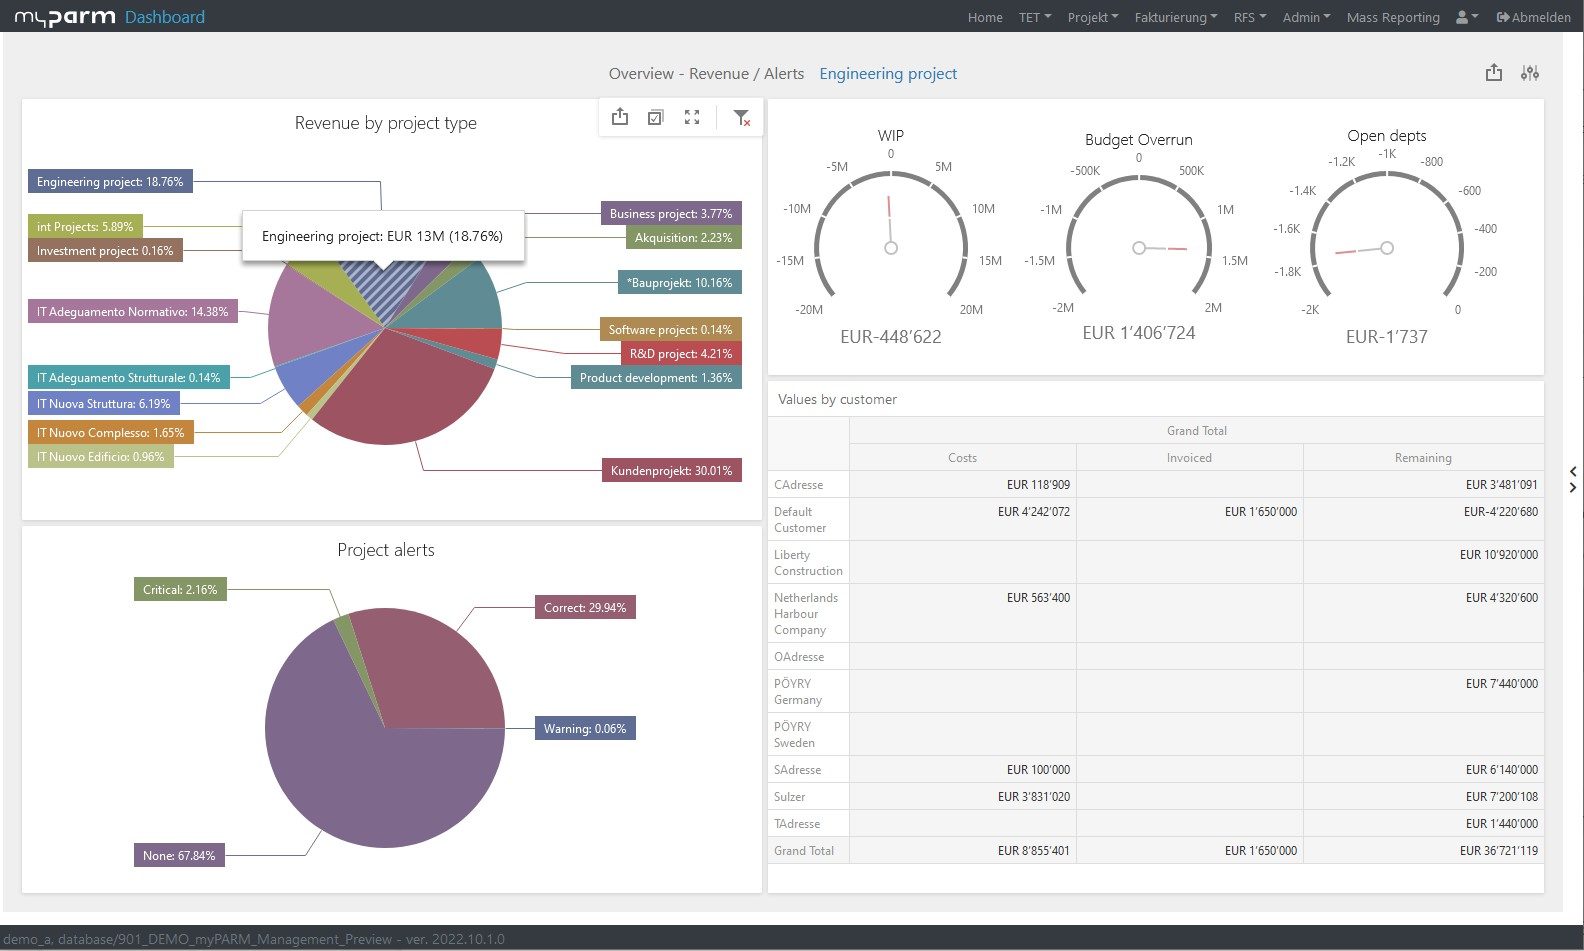
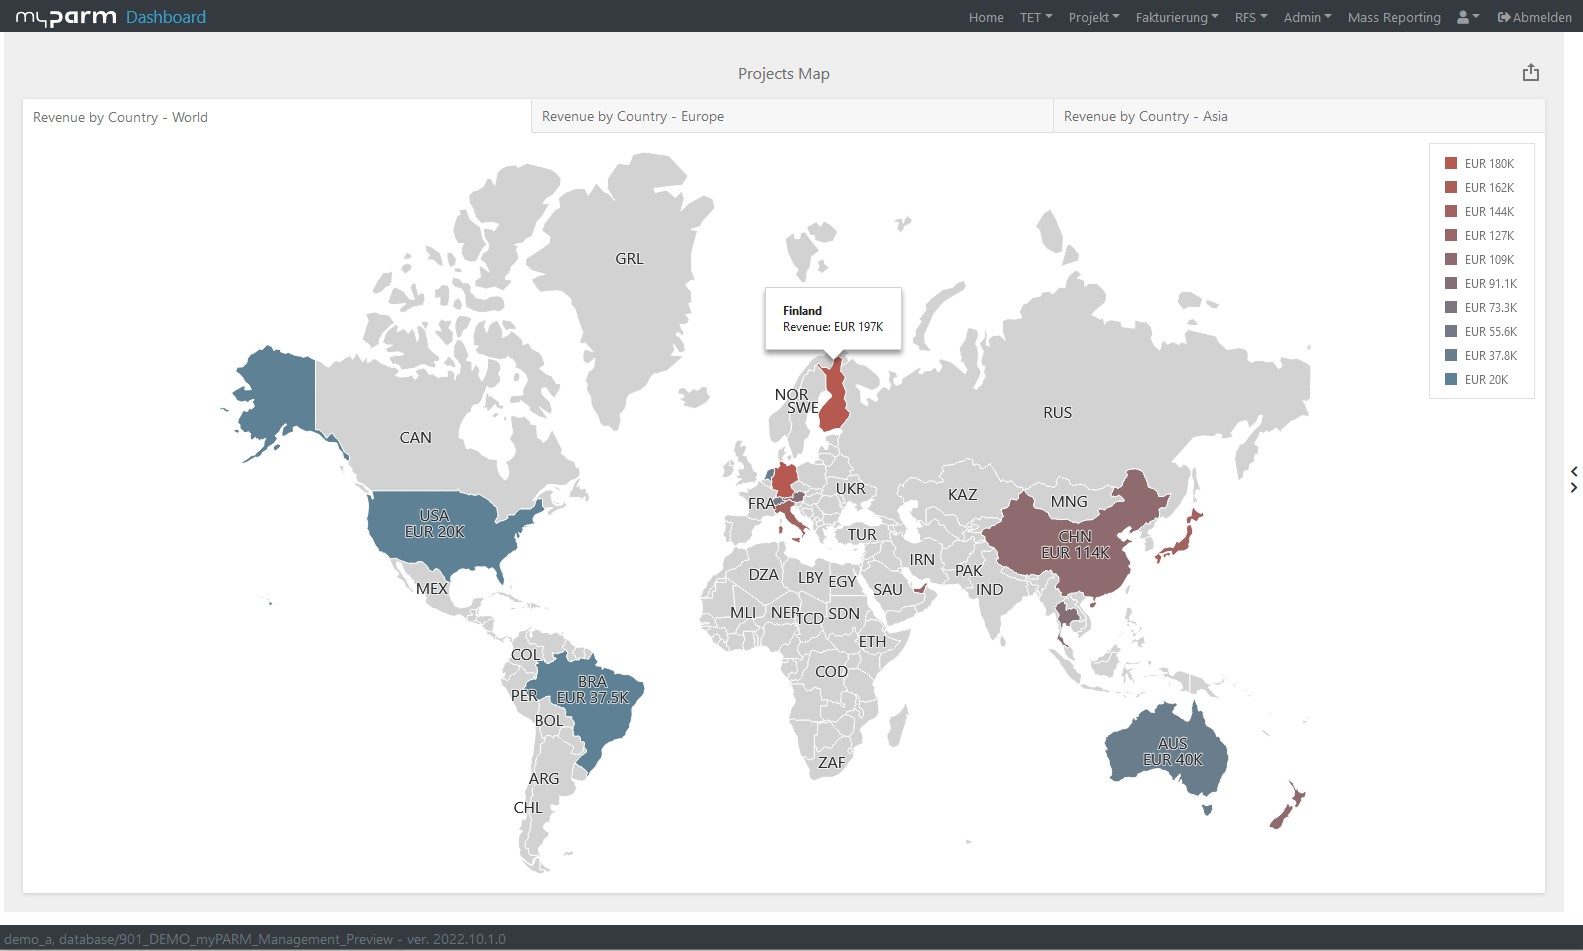
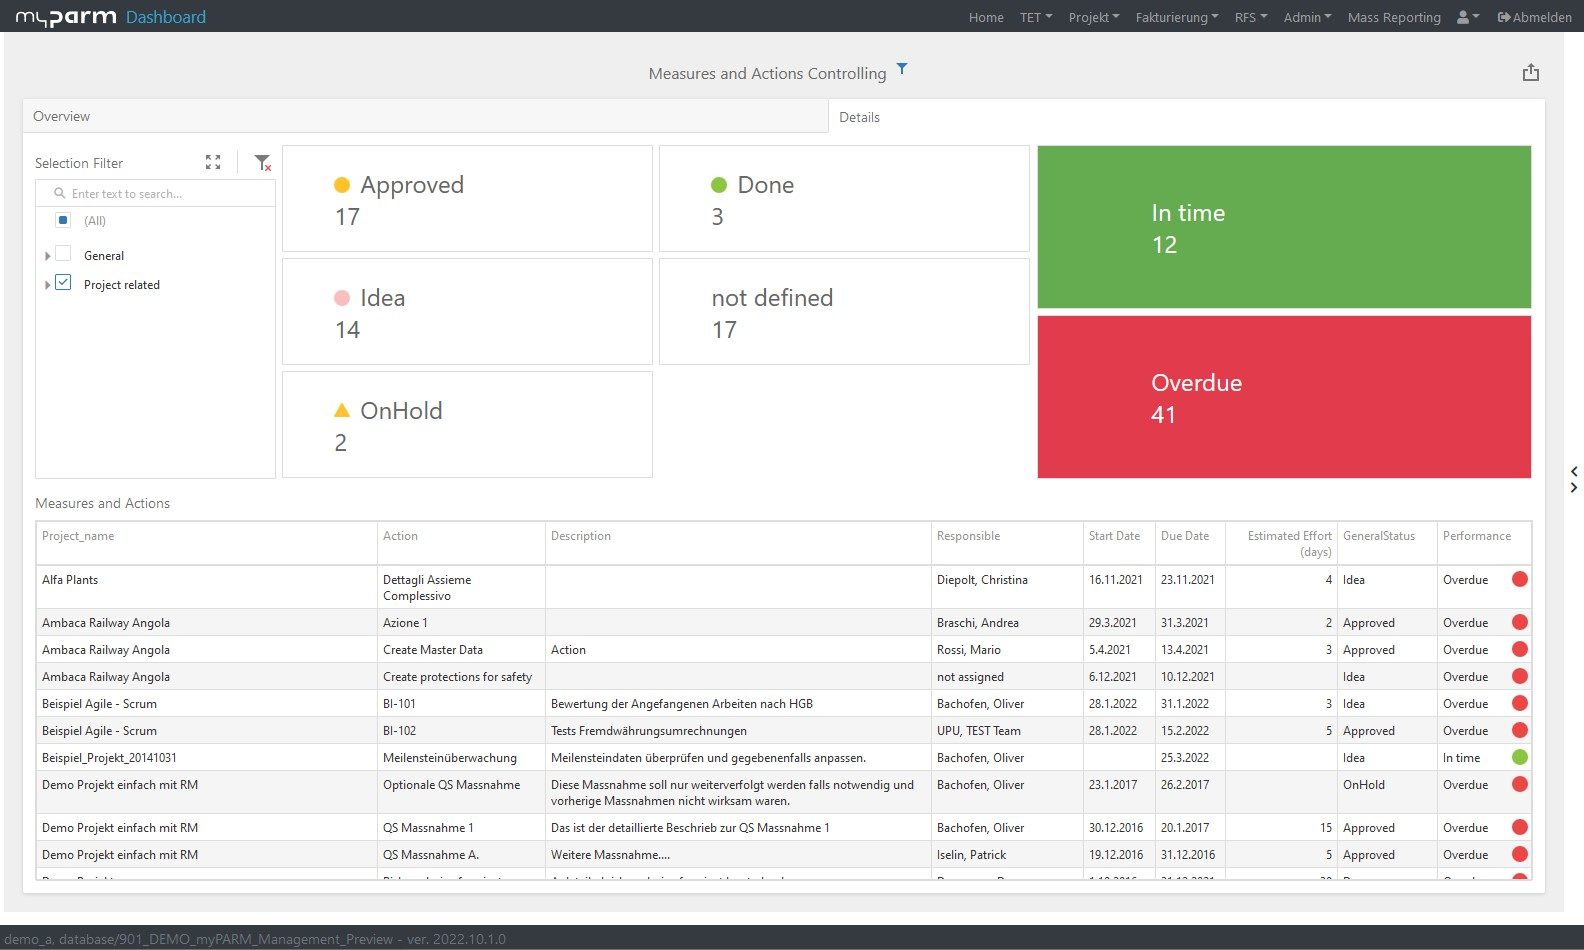
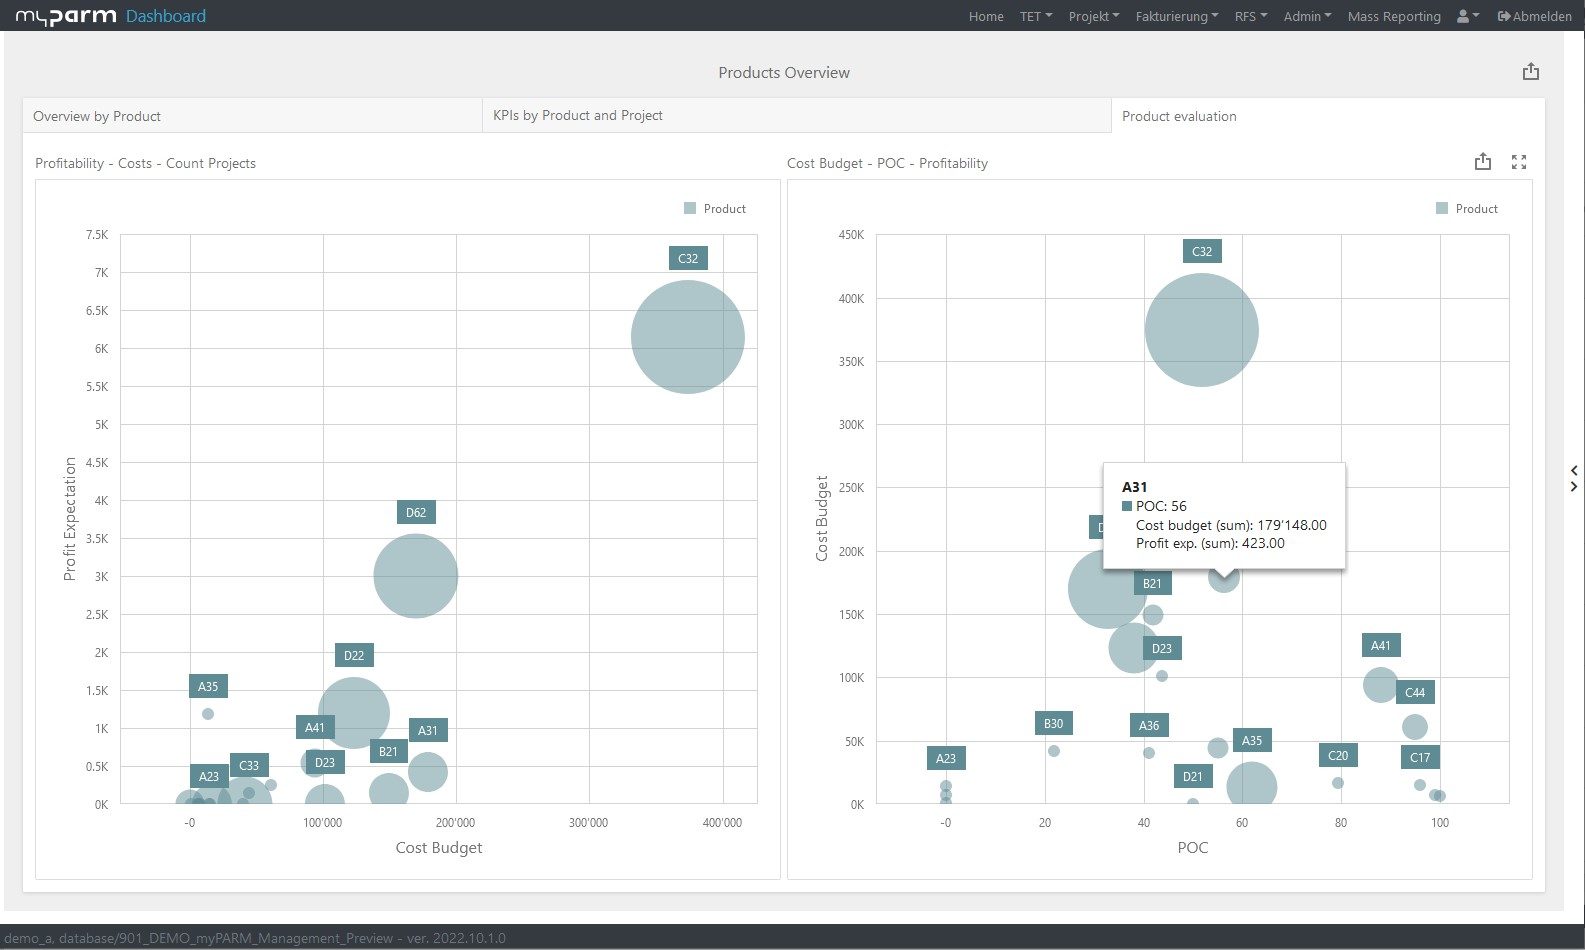
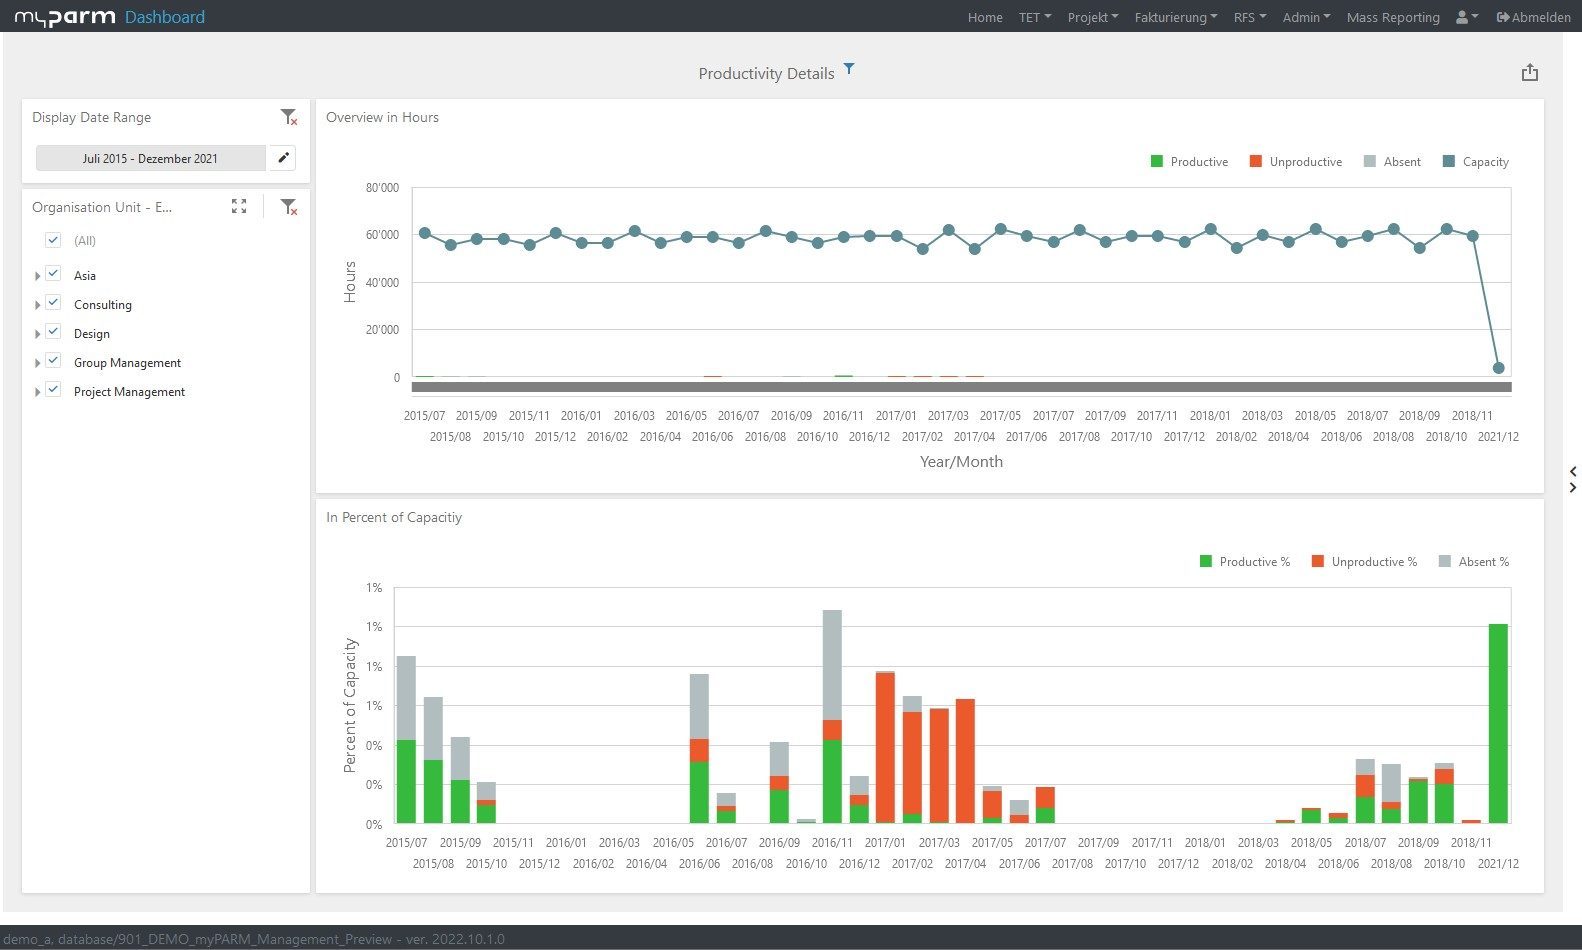
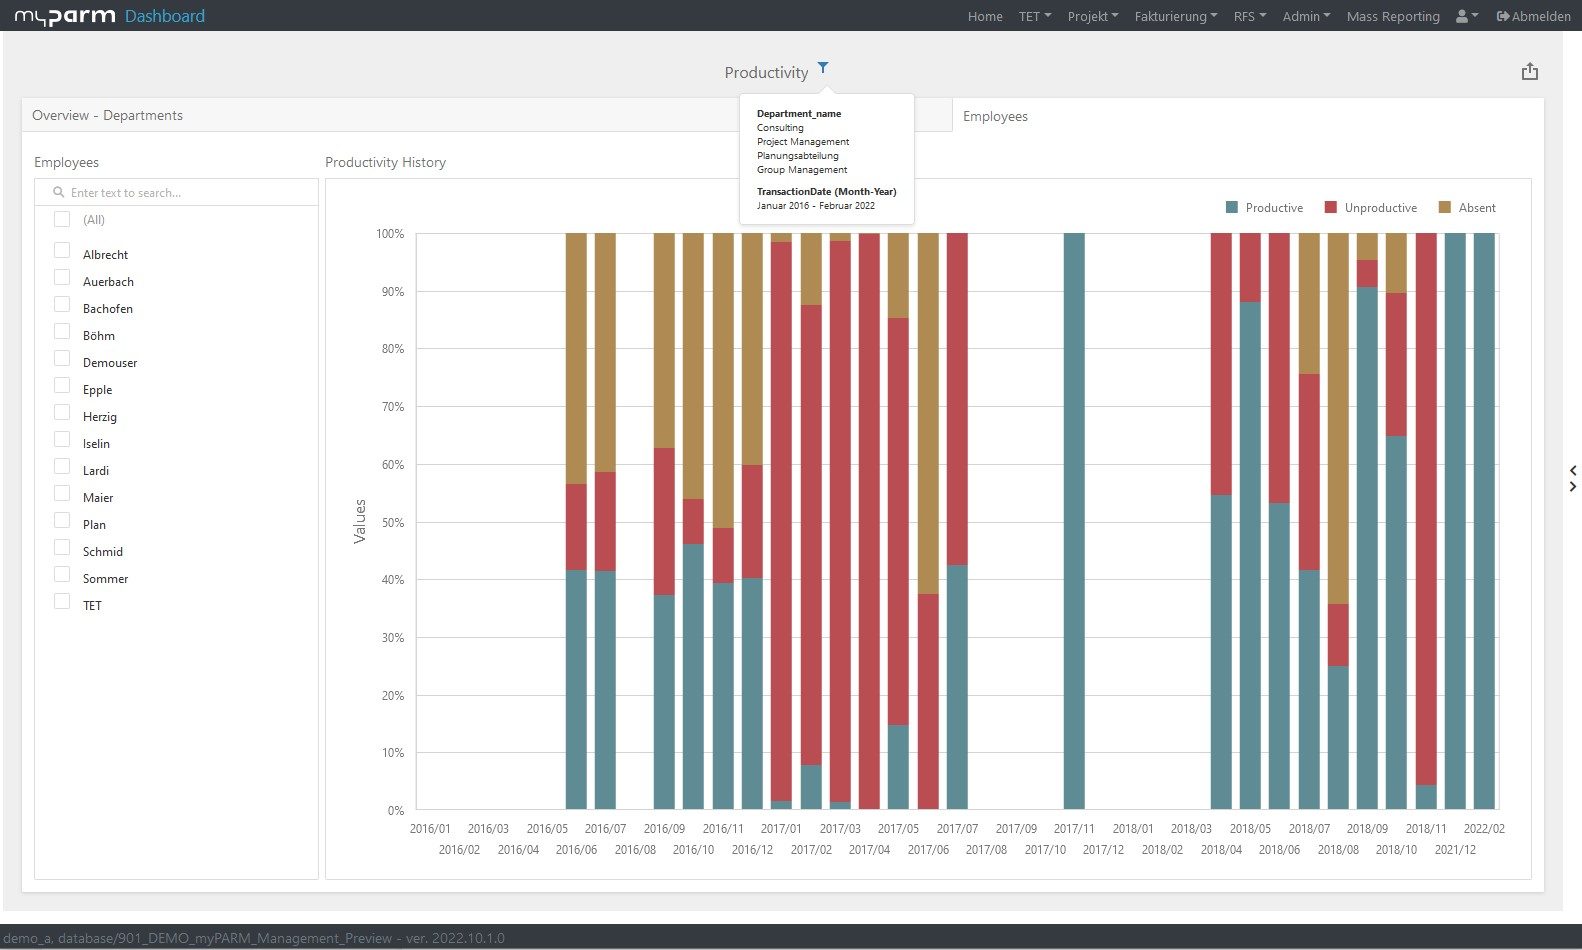
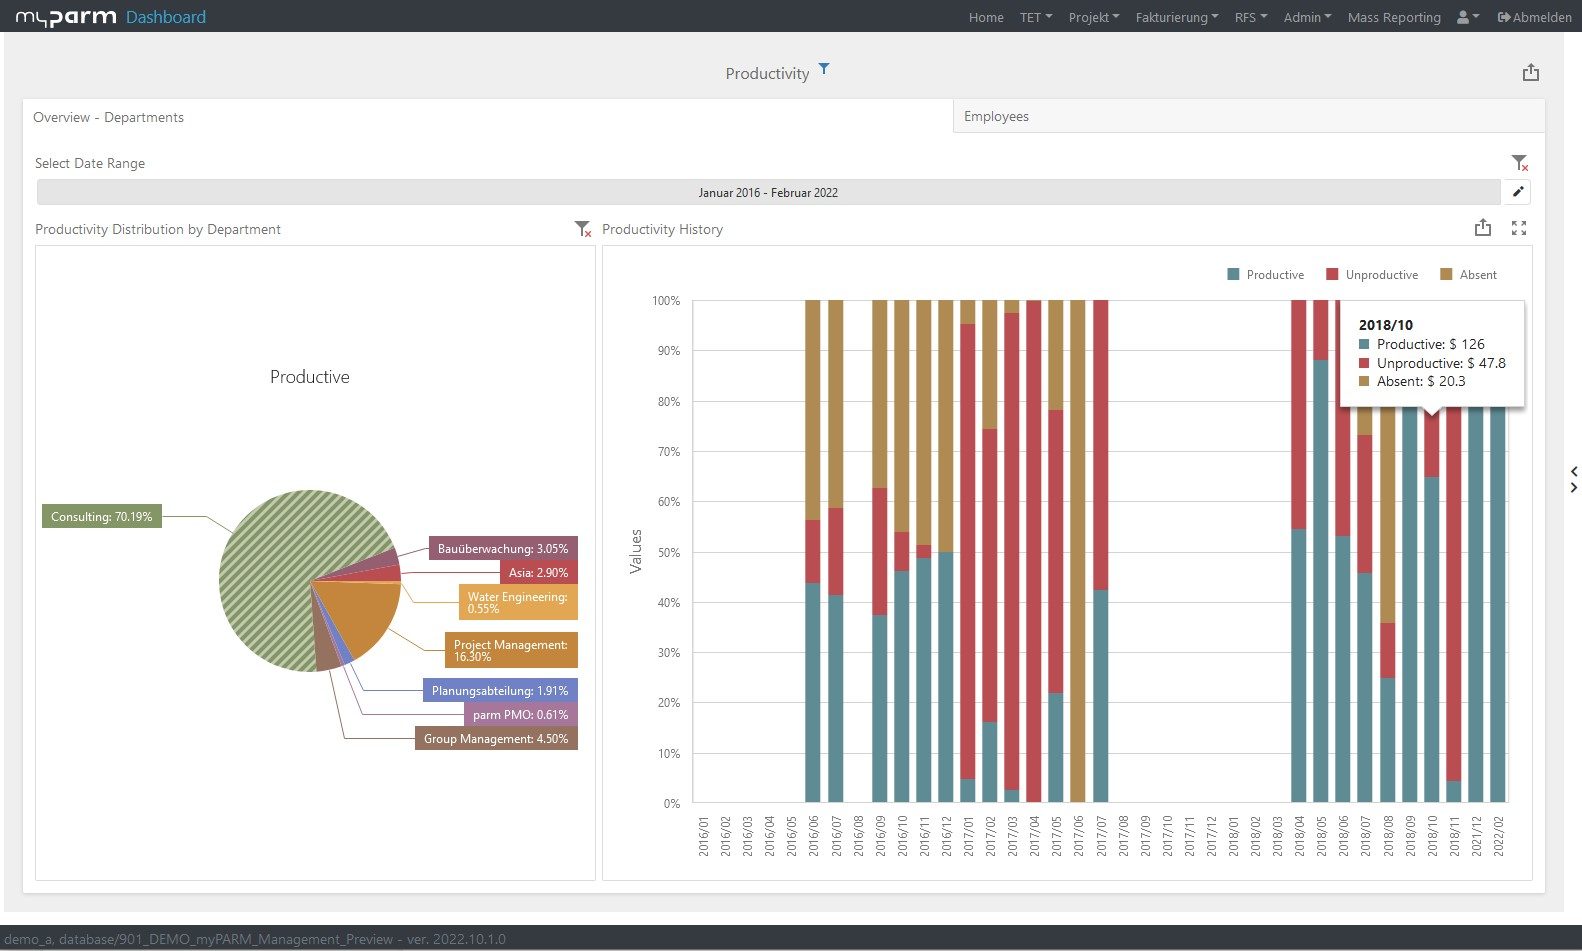
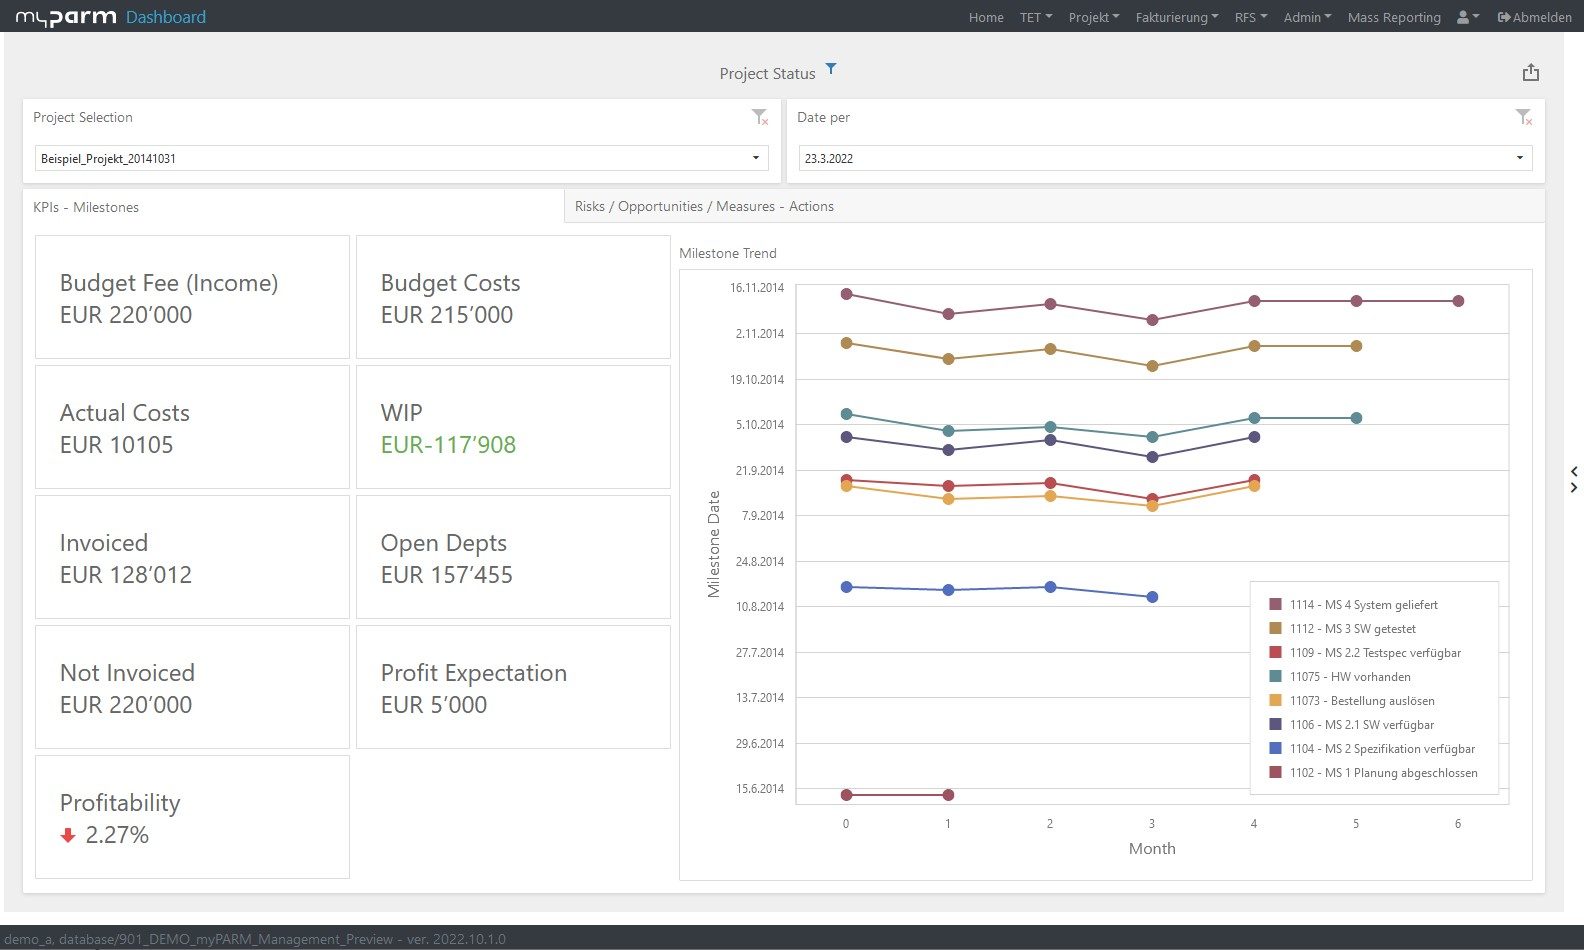
Interactive dashboards
Visualise your data in intelligent dashboards.
- Drill-down function
- various filters
- Export to various formats
Flexible data analysis
- Aggregations (sum and intermediate level)
- Calculations (Percent of total, Running summary, Difference, Percentage difference, moving average, rank, custom calculation)
- Dashboard Parameters
- Advanced Data Analytics
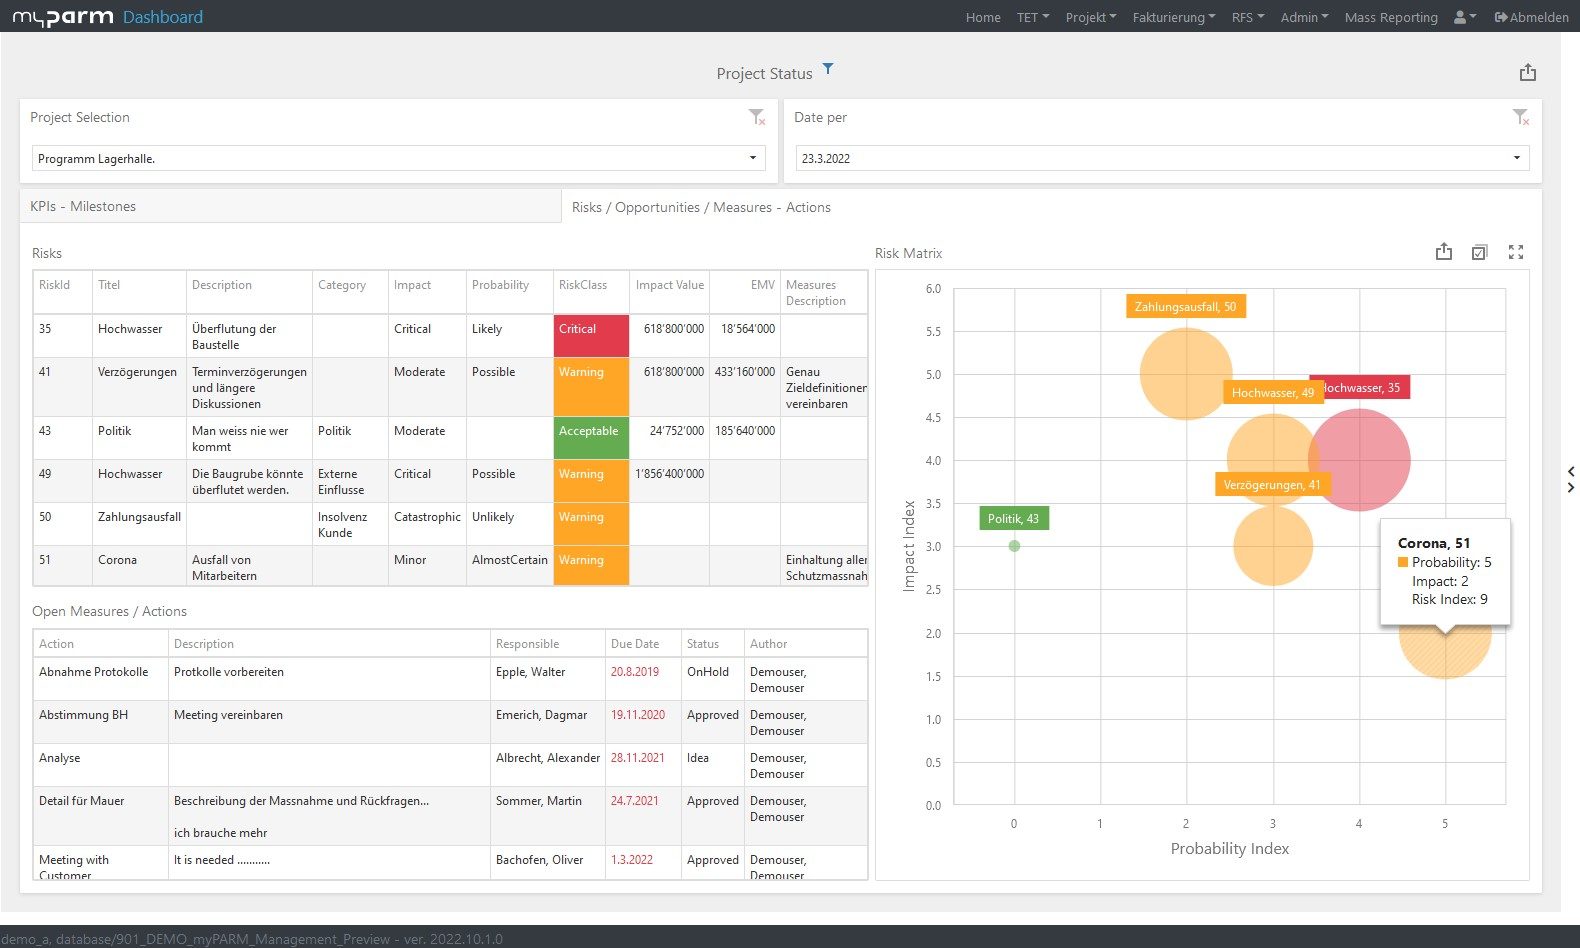
Risk and Opportunity Management
Systematic recording of risks and opportunities so that you can take measures to minimize risks or increase opportunities.
- Identifying opportunities and risks
- Qualitative risk analysis
- Quantitative risk assessment
- Task management/risk management/risk control
- Ongoing supervision/monitoring
Data processing
- Summarizing
- Grouping
- Sorting
- Filtering
- Top N
manual data addition
Provide supplementary information for all users in real time. This gives you a comprehensive picture of all relevant data.
- plan and actual data
- Qualitative additions
- Other data that is not yet available in any of your surrounding systems

Visual preparation of data according to your needs
Analyses are attractively presented visually so that you can get an optimal overview of them. A wide range of options are available for this purpose, which you can use according to your needs.