Project Management ABC: P for Precedence Diagram
Illustration of the process structure of projects, their duration and interdependencies

It is often used in procurement or production and can also provide valuable services in project management. We are talking about the precedence diagram, which can be used to identify the duration, buffer times and critical path of processes. In fact, very few project managers will regularly create precedence diagrams for their projects themselves, but will use project management software for this purpose. Nevertheless, it is important for project understanding to know how the precedence diagram is created.
What is a precedence diagram?
The precedence diagram is one of the most precise, but also most complex tools for representing operational processes in a strategically meaningful sequence. These can be projects, production processes, marketing processes or similar. In the precedence diagram, start and end times, buffers, dependencies as well as the entire duration of the process are also mapped. This makes it possible to organise processes precisely or to represent operational processes correctly. According to DIN 69900, the precedence diagram uses networks as a “graphic or tabular representation of a process structure consisting of operations or events and relationships.”
A precedence diagram can represent an entire project as an “overall network plan”. However, it is also possible to create ” subnetwork plans” that represent only a part of the project and that are linked to other subnetwork plans to represent the entire project. This decomposition of a precedence diagram is used in particular when individual stakeholders are not interested in details of the plan. In the context of this network plan summarisation, a network plan of the most important milestones can then be created for them, for example, while other stakeholders receive detailed subnetwork plans that are important for them.
How to create a network plan in a few steps
1. Create a basis
The basis for a precedence diagram is a process with its sub-steps. Both the individual steps and the duration of the respective tasks should be known.
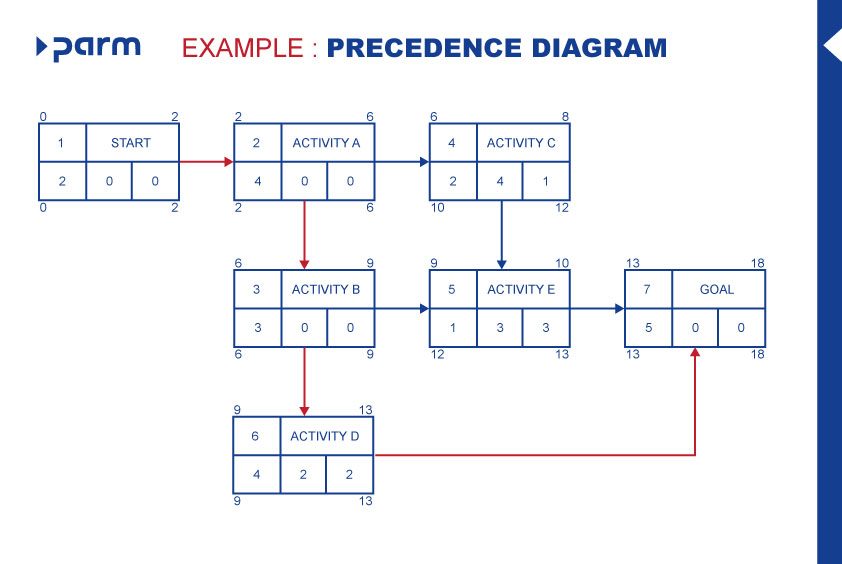
In the following example, the process consists of seven steps:
| Step | Duration in time unit | Process to be finished before |
| Start | 2 | – |
| Activity A | 4 | Start |
| Activity B | 3 | Activity A |
| Activity C | 2 | Activity A |
| Activity D | 1 | Activity B |
| Activity E | 4 | Activity B and C |
| Goal | 5 | Activity D and E |
These steps are now created in the form of so-called process nodes, which are then connected with each other according to their dependencies.
Such a node looks like this:

The abbreviations stand for the following values:
| Index | Process step |
| Activity | Activity name |
| D | Duration |
| ESP | Earliest start point |
| EEP | Earliest end point |
| LSP | Latest start point |
| LEP | Latest end point |
| TB | Total buffer |
| FB | Free buffer |
- The index marks the respective process step. It is usually given numbers or letters.
- For the activity, the activity name or a short, concise description is entered.
- At D, the duration of the process is entered.
- The earliest start point ESP indicates the earliest point at which a process can be started and is therefore dependent on preceding processes.
- The earliest end point EEP is calculated from the earliest start point and the duration of an operation and thus indicates when the activity can be completed at the earliest.
- The latest end point LEP indicates when an operation must be completed at the latest in order not to delay further process steps.
- The latest start point LSP is calculated by subtracting the duration of a process from the latest end point. Thus, it indicates when the processing of an operation should be started at the latest in order not to influence further process steps and thus delay the entire process.
- The total buffer TB indicates by how much time a process can be postponed without having to postpone the latest start point of the next activity. If this buffer is used up, the following activity no longer starts on the earliest possible date, but the end date of the project is not affected.
- The free buffer FB, on the other hand, states how long an activity can last without influencing the earliest start point of the subsequent activities.
2. Connect nodes
First, a network is created with the existing data. This means that the individual nodes are entered with index, activity and duration. These nodes are then linked with arrows that result from the dependencies shown in the table. An arrow marks a relationship or the logical, technical, personal or temporal dependency of individual activities. In the example, activity E can only be started when activities B and C have been completed. Therefore, an arrow is directed from each of the activities B and C to activity E.

3. Forward scheduling
In the following forward scheduling, the paths are walked through from beginning to end, whereby the earliest start point (ESP) and the earliest end point (EEP) are entered in each case. The following applies:
- The ESP of the first process step is always 0.
- The EEP is always calculated from ESP and duration. EEP = ESP + D
- The EEP of an operation is at the same time the ESP of the subsequent step and can therefore be easily transferred on the basis of the dependencies.
- If a node has several upstream process steps, the EEP with the highest value applies.

4. Backward scheduling
The paths are then traversed from the end to the beginning, whereby the latest start point and the latest end point are entered in each case. The following applies:
- The LEP of the last step corresponds to its EEP. Thus it forms the starting point of the backward scheduling.
- The LSP is calculated by subtracting the duration from the LEP. LSP = LEP – D
- The LSP of an activity is the LEP of the previous activity.
- If an activity has several successors, the smallest LSP is taken over in each case.

5. Buffer
Now the buffers for each activity can be calculated:
- The total buffer TB is the difference between LSP and ESP. TB = LSP – ESP
- The free buffer (FB) is calculated from the difference of the ESP of the following process step and the EEP of the current activity. If there are several successors, the smallest alternative counts. FB = ESP (successor) – EEP (predecessor)

6. Critical path
The critical path can now be added to the complete diagram. These are all the sub-steps that must not be delayed if the originally planned end date is to be met. Accordingly, you find the critical path by identifying all process steps that have neither a free buffer nor a total buffer.

Special dependencies
The previous example is based on the fact that a preceding process must be completed in order to be able to start a subsequent process. This is called an end-to-start relationship. This is called an end-to-start relationship. In practice, however, there are also other dependencies, which can also be combined with necessary delays:
End to start / Normal Sequence
Activity A must be finished so that activity B can start.
- ESP (B) = EEP (A) + delay
- LEP (B) = LSP (A) – delay
Start to Start / Start Sequence
Activity B can be started as soon as activity A has been started.
- ESP (B) = ESP (A) + delay
- LEP (B) = LSP (A) – delay + D (B)
End to End / End Sequence
Activity B can be finished as soon as activity A has been finished.
- ESP (B) = EEP (A) + delay – D (B)
- LEP (B) = LEP (A) – delay
Start to End / Jump Sequence
Activity B can be finished as soon as activity A has been started. This results in a negative buffer.
- LSP (B) = ESP (A) – delay + D (B)
- LEP (B) = LEP (A) + delay + D (B)
Advantages of the precedence diagram
- Simple determination of the total duration of a process or project
- Display of the sequence and dependencies of all activities in a process or project.
- Overview of the entire process or project, as well as individual activities, their duration, deadlines and buffers
- Basis for scheduling and resource planning in the project
- Showing the critical path enables the identification of risks in the process or project and, for example, the planning of buffers in advance.
- Buffer times allow you to seize opportunities in the process and thus streamline the process or project.
- With the help of the network, you can easily assess whether the process or project is on schedule.
Disadvantages of the precedence diagram
- High effort to create and, if necessary, to correct, as each individual process must be entered in detail.
- High effort if the plan has to be adjusted due to delays
Conclusion
A precedence diagram is an important tool in project management as it shows the whole project with all activities, their duration and dependencies in a logical sequence. It enables the critical path to be recognised and buffers to be identified. In this way, risks and opportunities can be identified and acted upon.
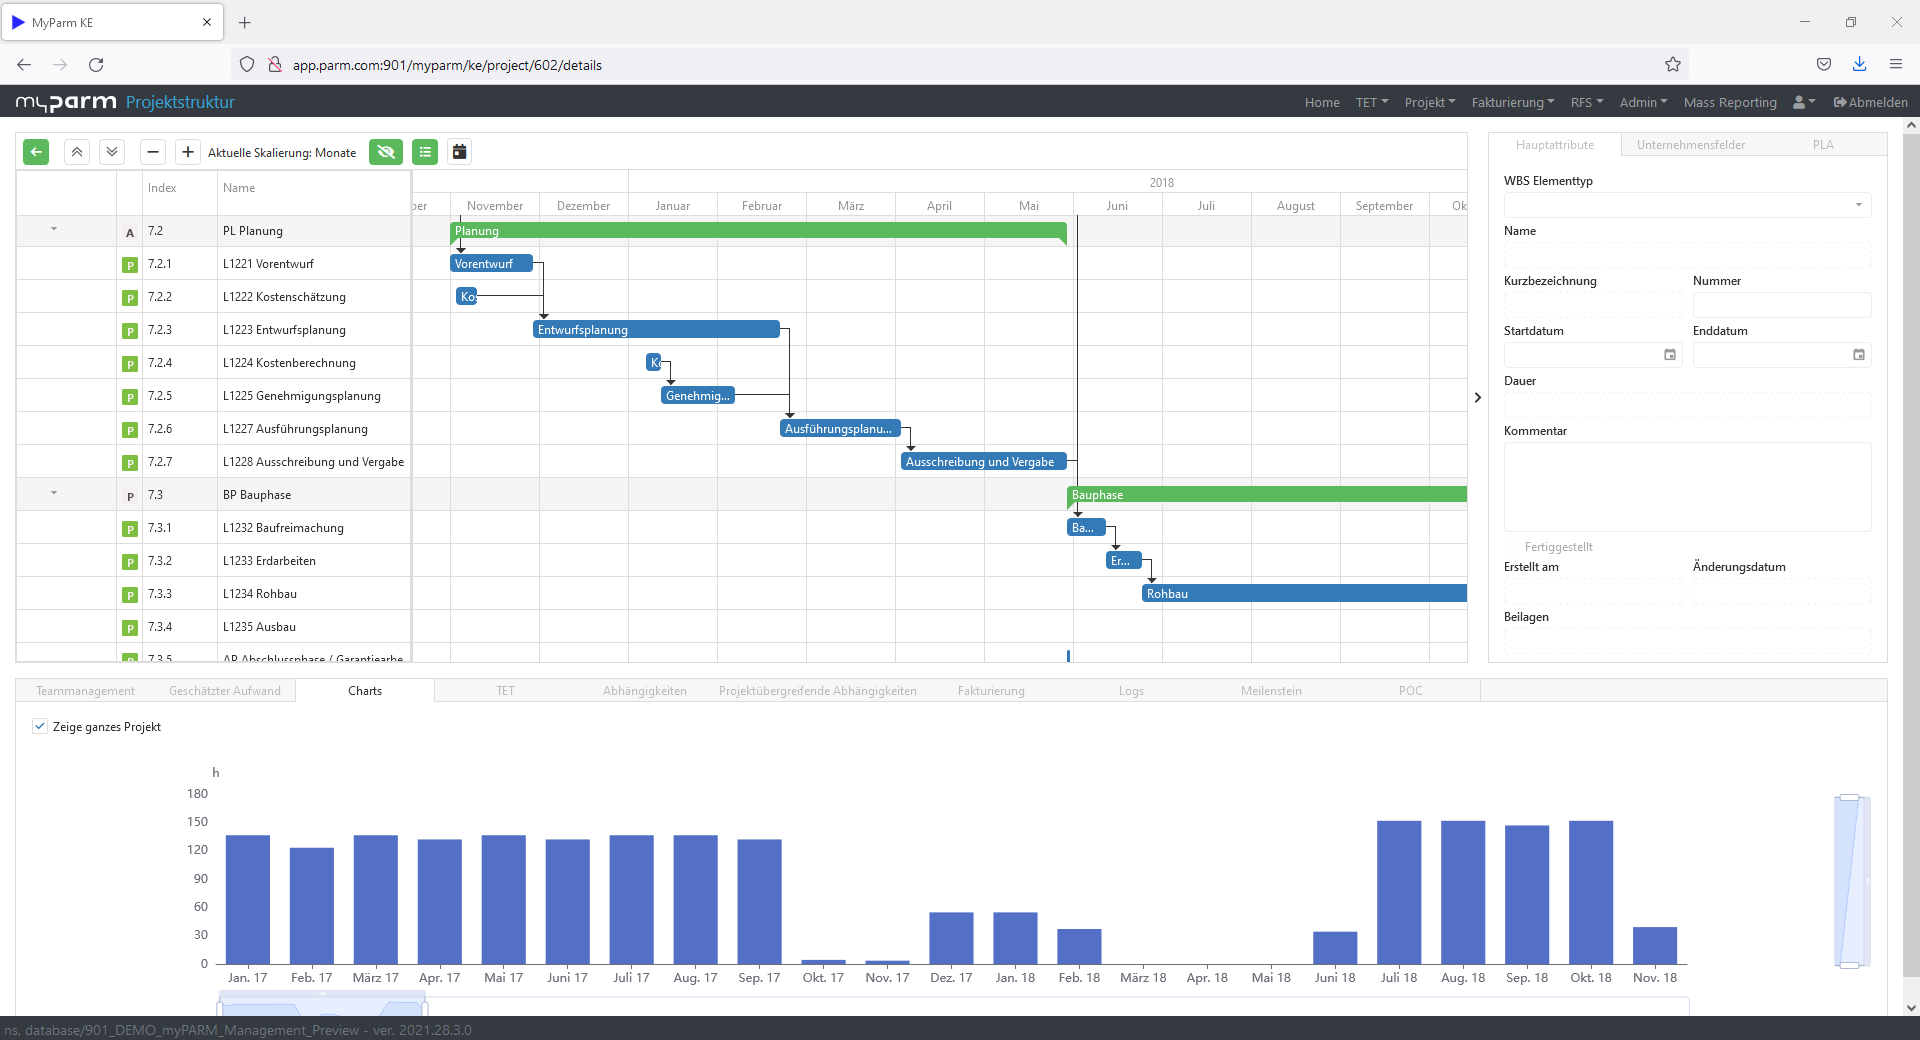
Creating a network plan manually takes a long time, especially for large projects, and maintenance in case of delays or changes is extremely time-consuming. Therefore, it makes sense to use project management software for this purpose. This usually uses a special form of network plan, the Gantt chart. In this way, buffers and the critical path are automatically calculated when the project is created and the duration of the individual processes is also visualised by means of a bar chart.
More about the project management software myPARM:
Would you like to get to know myPARM in a demo presentation? Then make an appointment with us right away!

