Best practices for effective management reporting
Strategies for optimizing your business decisions

Effective management reporting plays a central role in the strategic alignment and performance optimization of businesses. By communicating key information clearly, executives can make well-informed decisions, allocate resources efficiently, and continuously monitor company performance. In this post, we introduce proven practices that will help you establish optimal management reporting within your organization.
What exactly is management reporting and why is it so important?
Management reporting is the process of collecting, analysing, and communicating relevant business information as well as performance metrics to the executive level of a company. It is the key mechanism that assists leaders in comprehending and evaluating the health and performance of the business, enabling them to make informed decisions based on data. Reports consolidate data from various sources to derive performance indicators, trends, deviations, and recommendations. Thus, effective management reporting offers a clear overview of the company’s current state, supporting strategic planning and the implementation of corporate strategy.
At the heart of management reporting lies the transformation of raw data into meaningful insights. It involves a systematic approach that filters the abundance of information from different departments and sources to present the most important data in an understandable format.
The significance of management reporting extends across various aspects:
- Informed decision-making: Management reporting provides decision-makers with the information they need to make informed and data-driven choices. This reduces uncertainties and minimizes the risk of misjudgments.
- Performance monitoring: Additionally, effective management reporting enables companies to measure and monitor their performance using KPIs and objectives. It reveals strengths, weaknesses, and changes in business operations.
- Strategy development and validation: Reporting offers insights into the effectiveness of current strategies. Leaders can identify trends indicating the need for adjustments or realignments.
- Communication and alignment: Through clear and comprehensible reports, executives at all levels of the company can achieve a unified understanding of corporate goals, progress, and challenges.
- Identifying opportunities and risks: Management reporting aids not only in identifying opportunities for performance enhancement but also in recognizing potential risks that need early attention.
- Employee motivation and leadership: Transparency through management reporting can contribute to motivating employees, as they can recognize the impact of their work on the overall company.
In today’s data-driven era, effective management reporting is more than a mere necessity; it is a critical component of business success. By bridging the gap between information and decision-making, management reporting enables your company to be more agile, targeted, and strategically oriented, forming an essential foundation for sustainable growth and competitiveness amid constantly changing circumstances.
Best practices in management reporting
1. Clear objectives, defined audience, and good planning
Before creating a management report, it’s essential to define clear objectives. This helps you identify which information is relevant to different decision-makers. Therefore, you should also identify your target audience and their information needs to tailor the reports accordingly. Some executives might need detailed financial reports, while operational managers might require insights into production performance or customer satisfaction. Plan the reporting frequency accordingly to ensure that relevant information is regularly updated and available when needed. When formulating goals, consider the following points:
- Clearly stated reporting objectives: The objectives of management reporting should be clearly articulated. They define the purpose and value of reporting, setting the direction for the entire process. Whether it’s tracking revenue development, measuring customer satisfaction, or monitoring supply chain efficiency – each goal must be specific, measurable, achievable, relevant, and time-bound (SMART criteria). This ensures that all stakeholders understand what insights the reporting should provide and how the selected figures and facts contribute to the overall strategy.
- Alignment with strategic goals: The true power of management reporting unfolds when it harmoniously aligns with the company’s overarching strategic goals. Reporting should, therefore, be aligned with the long-term objectives of the company. For instance, a strategic goal might be to increase market share in a specific segment. The reporting should then contain specific KPIs that measure progress in that segment. This linkage lends depth to the reporting and demonstrates how each analysis and figure contributes to the bigger picture.
- Leveraging synergies: The clarity of reporting objectives and their integration into strategic goals create powerful synergy. They enable more targeted data collection, more accurate analysis, and more precise presentation of results. This way, executives gain a clear overview of how their decisions impact the overall strategy and can make adjustments if necessary.
2. Selection of key performance indicators (KPIs)
Key Performance Indicators (KPIs) are metrics that make progress toward business objectives measurable. To avoid overwhelming the report’s recipients with unnecessary information, select only the KPIs that best reflect the goals defined in the first step. When selecting KPIs, consider the information needs of the report’s audience and how you can answer readers’ questions using metrics. Also, strike the right balance between financial and non-financial KPIs to gain a comprehensive view of company performance. Remember that less is often more and focus on KPIs that truly provide insights and support decisions.
3. Data procurement and validation
The quality of reporting heavily depends on the quality of data. Hence, it’s important to choose reliable data sources and verify data for accuracy and consistency. Thorough data validation is key to building informed decisions on reliable information. Duplicate records, outdated information, and incomplete datasets can lead to faulty analyses and decisions. Therefore, we recommend establishing a data maintenance routine to uphold data quality at a high level.
However, collecting data from various sources and ensuring their quality is quite complex and time-consuming. This is where Business Intelligence (BI) tools and data integration platforms come in handy, automating data collection. These tools automatically extract, transform, and store the necessary data from different sources in a central repository. This speeds up the process, minimizes errors, and enhances data quality.
4. Data visualization
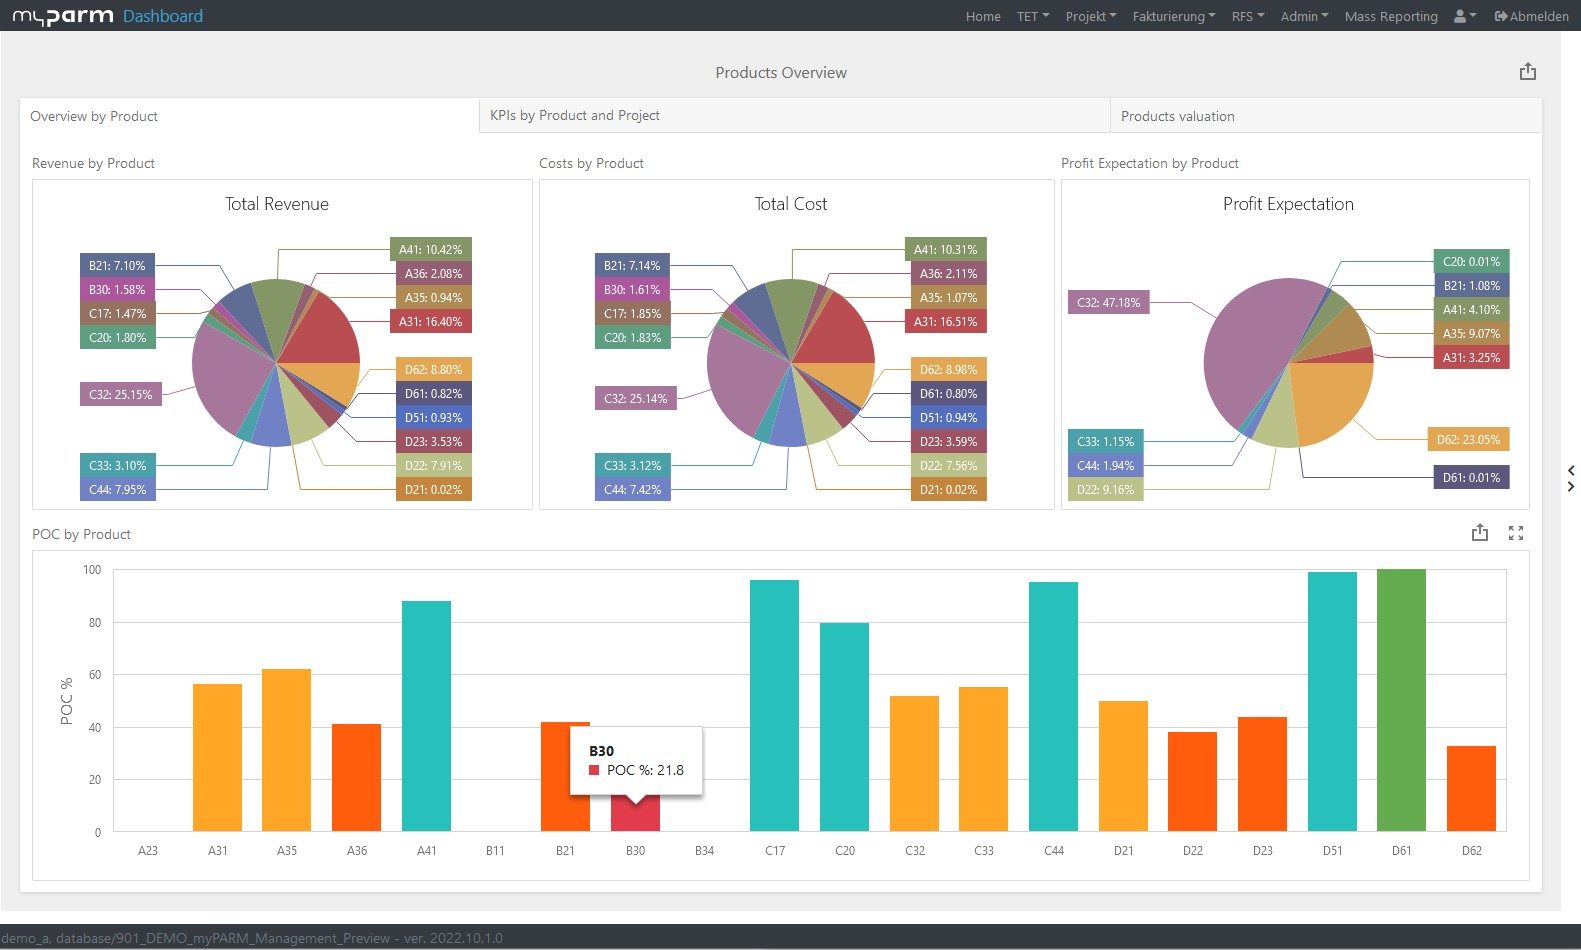
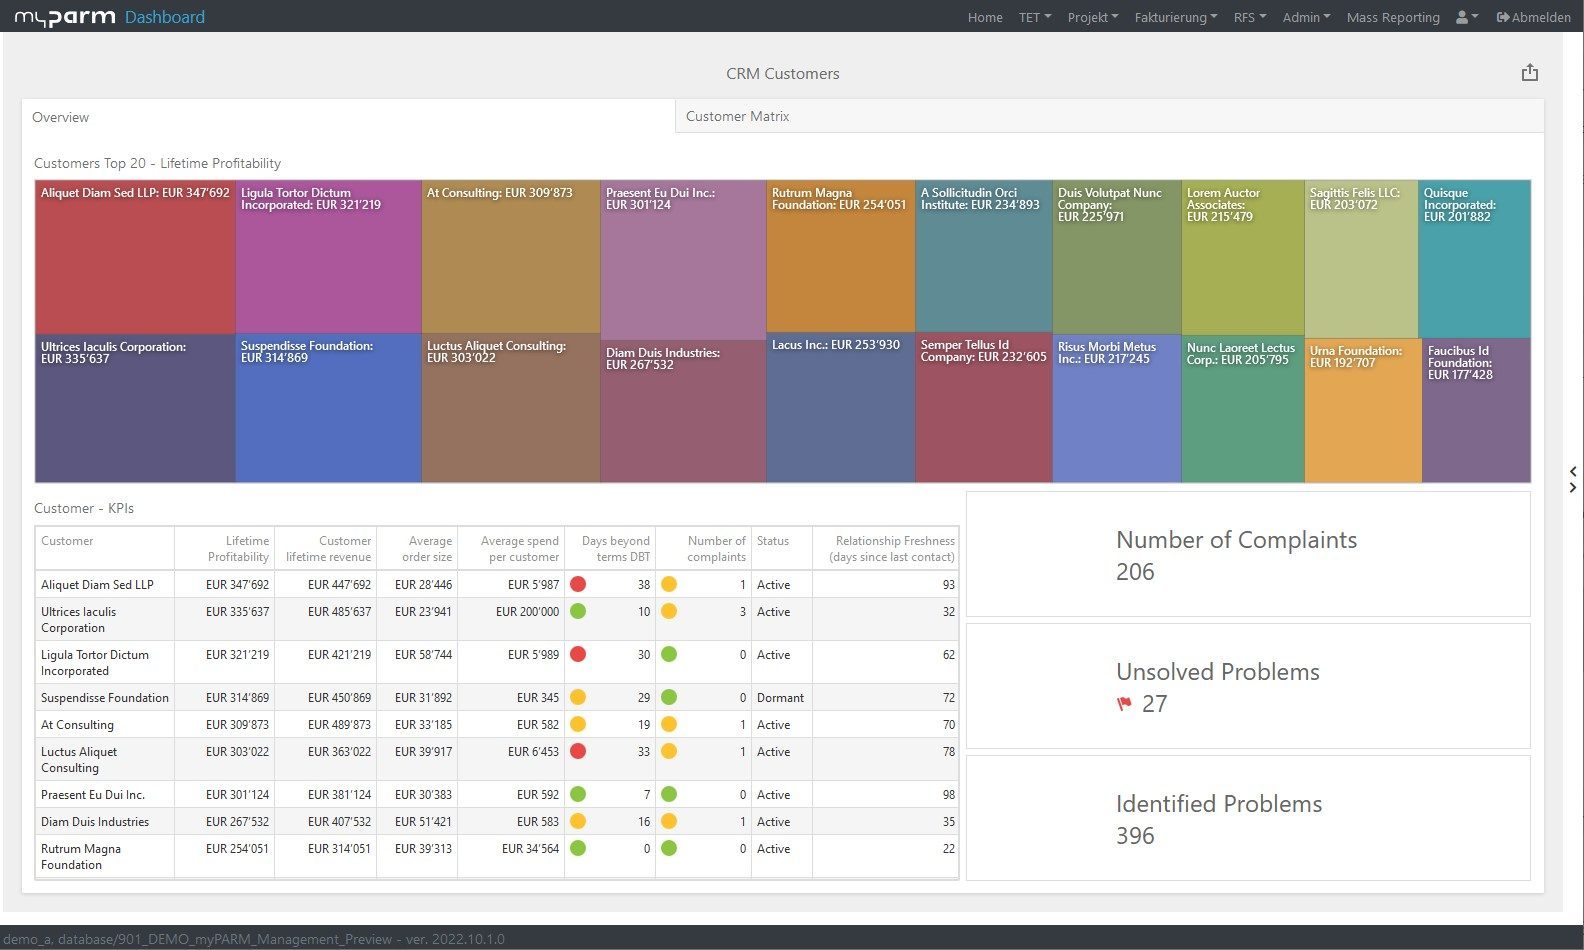
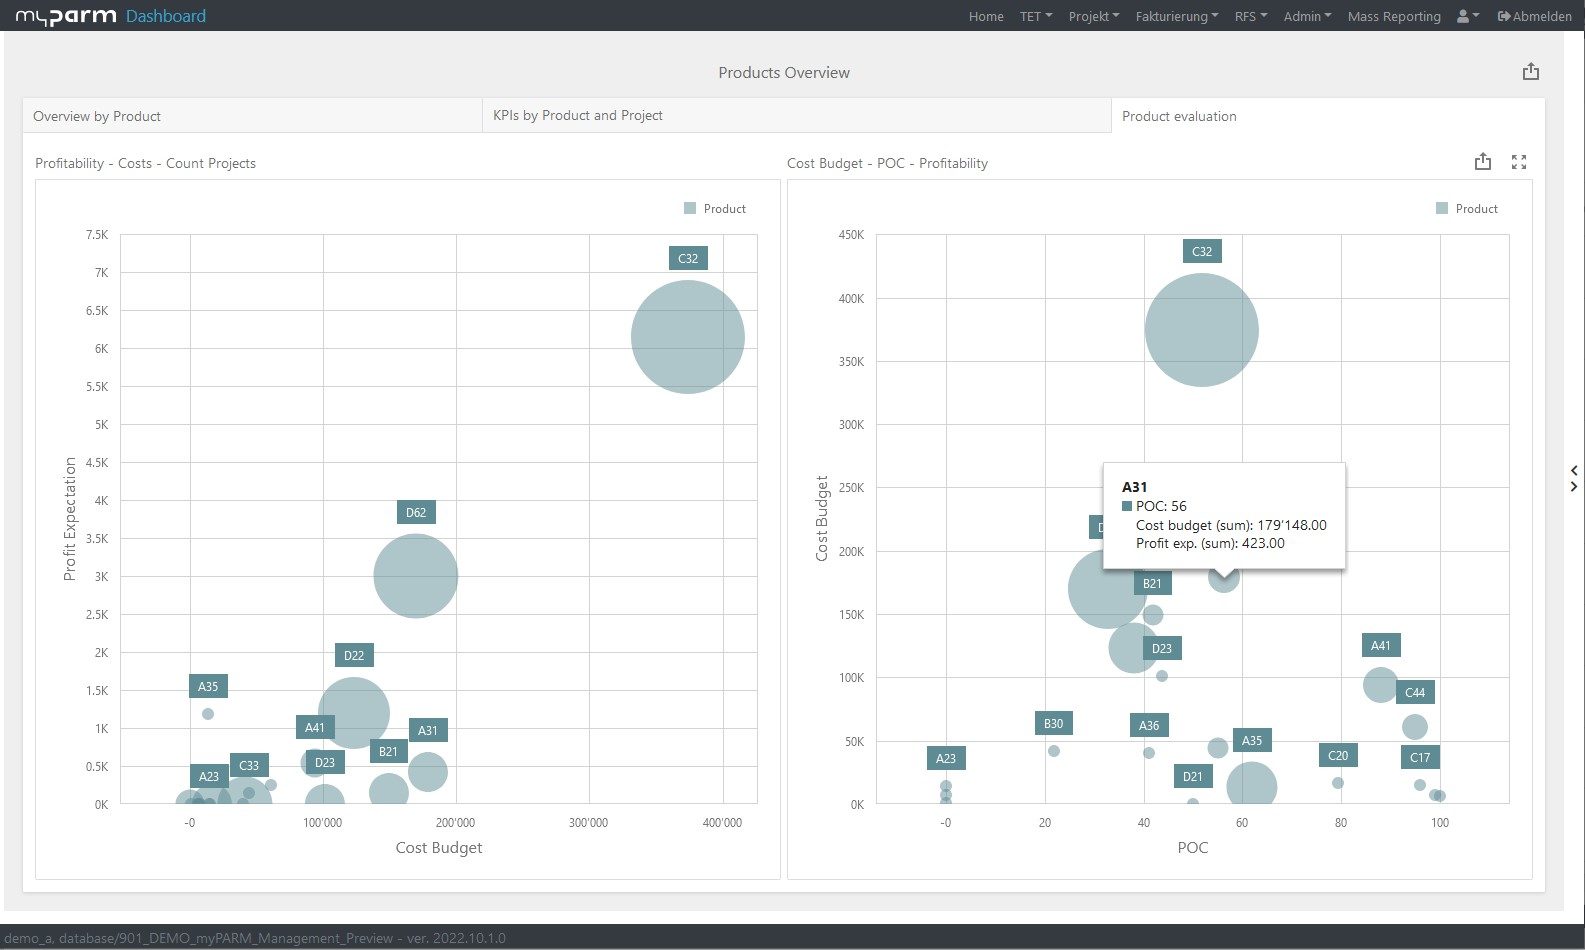
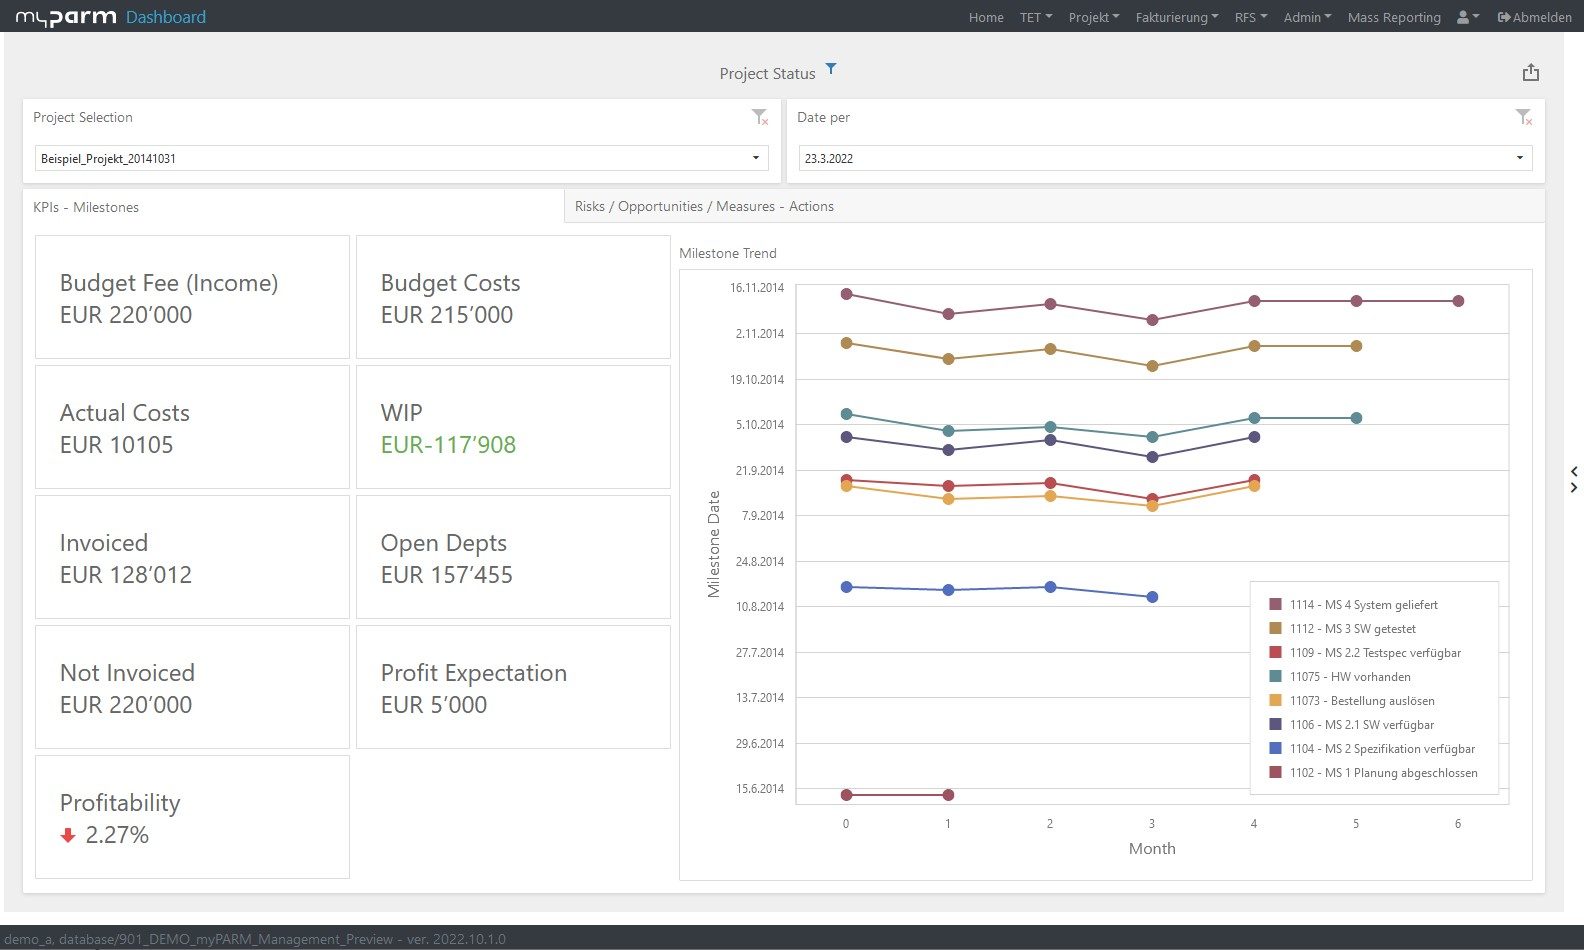
Visualizations transform dry data into meaningful stories. The use of charts, graphs, and dashboards gives your data a tangible dimension. Instead of sifting through endless tables, executives can recognize patterns, trends, and correlations at a glance. For instance, a revenue report can be much more impactful if presented in a bar chart illustrating sales performance over various months.
This is because visualizations are not just aesthetically pleasing; they also have a deeper impact on information absorption. The human brain processes images faster than text, allowing visual representations to communicate complex data in an easily understandable manner. They facilitate pattern recognition, deviation identification, and quick access to important information.
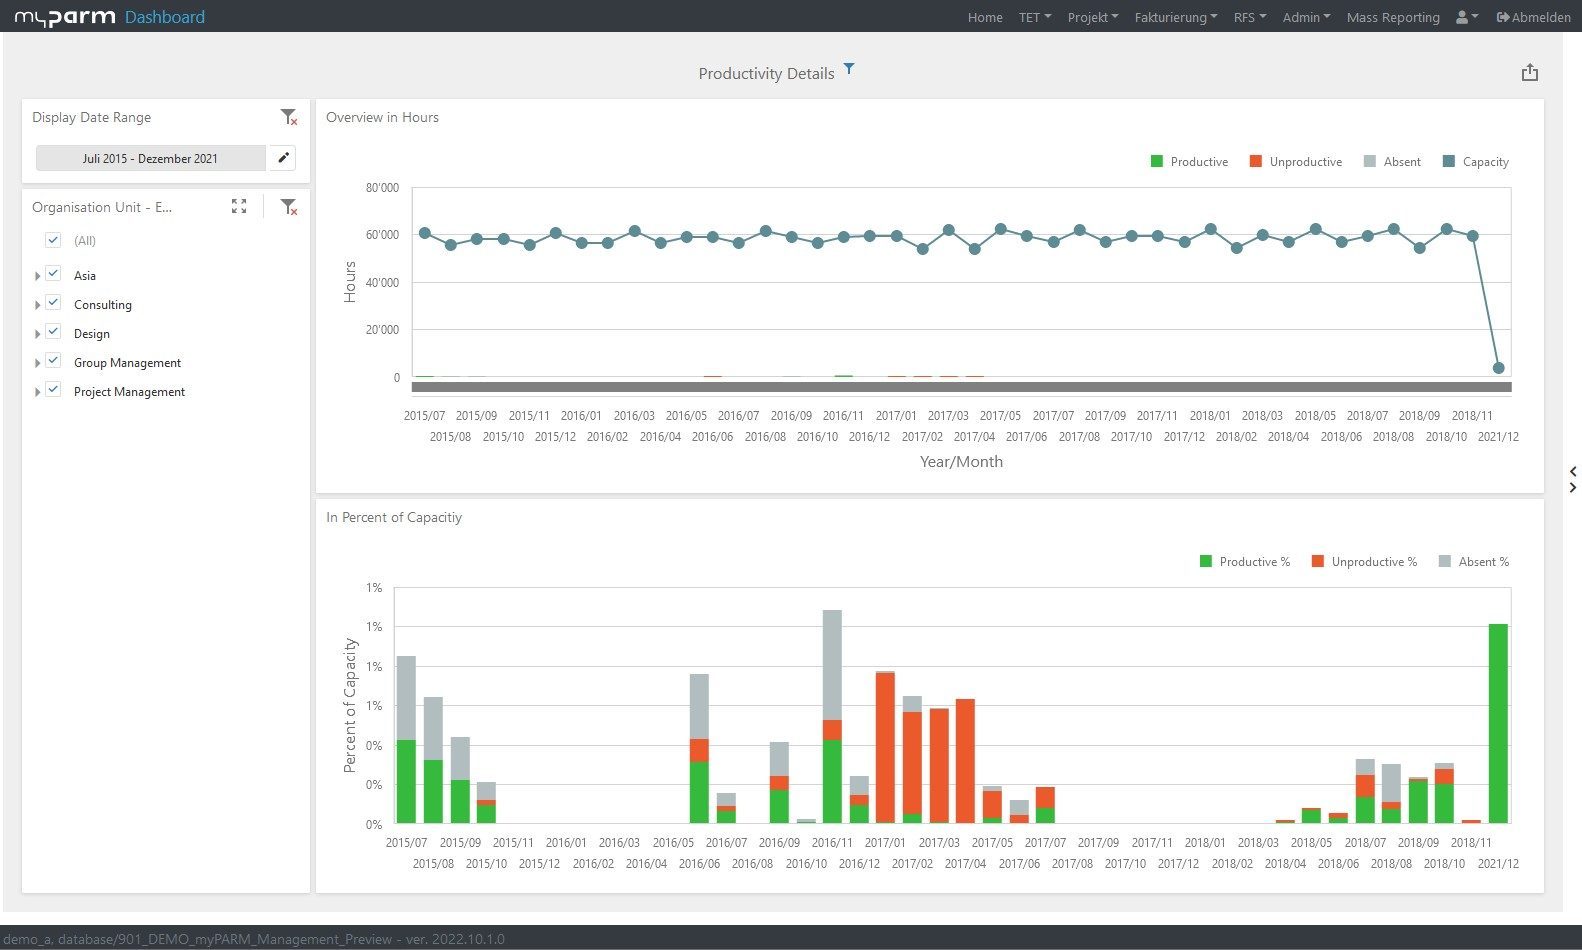
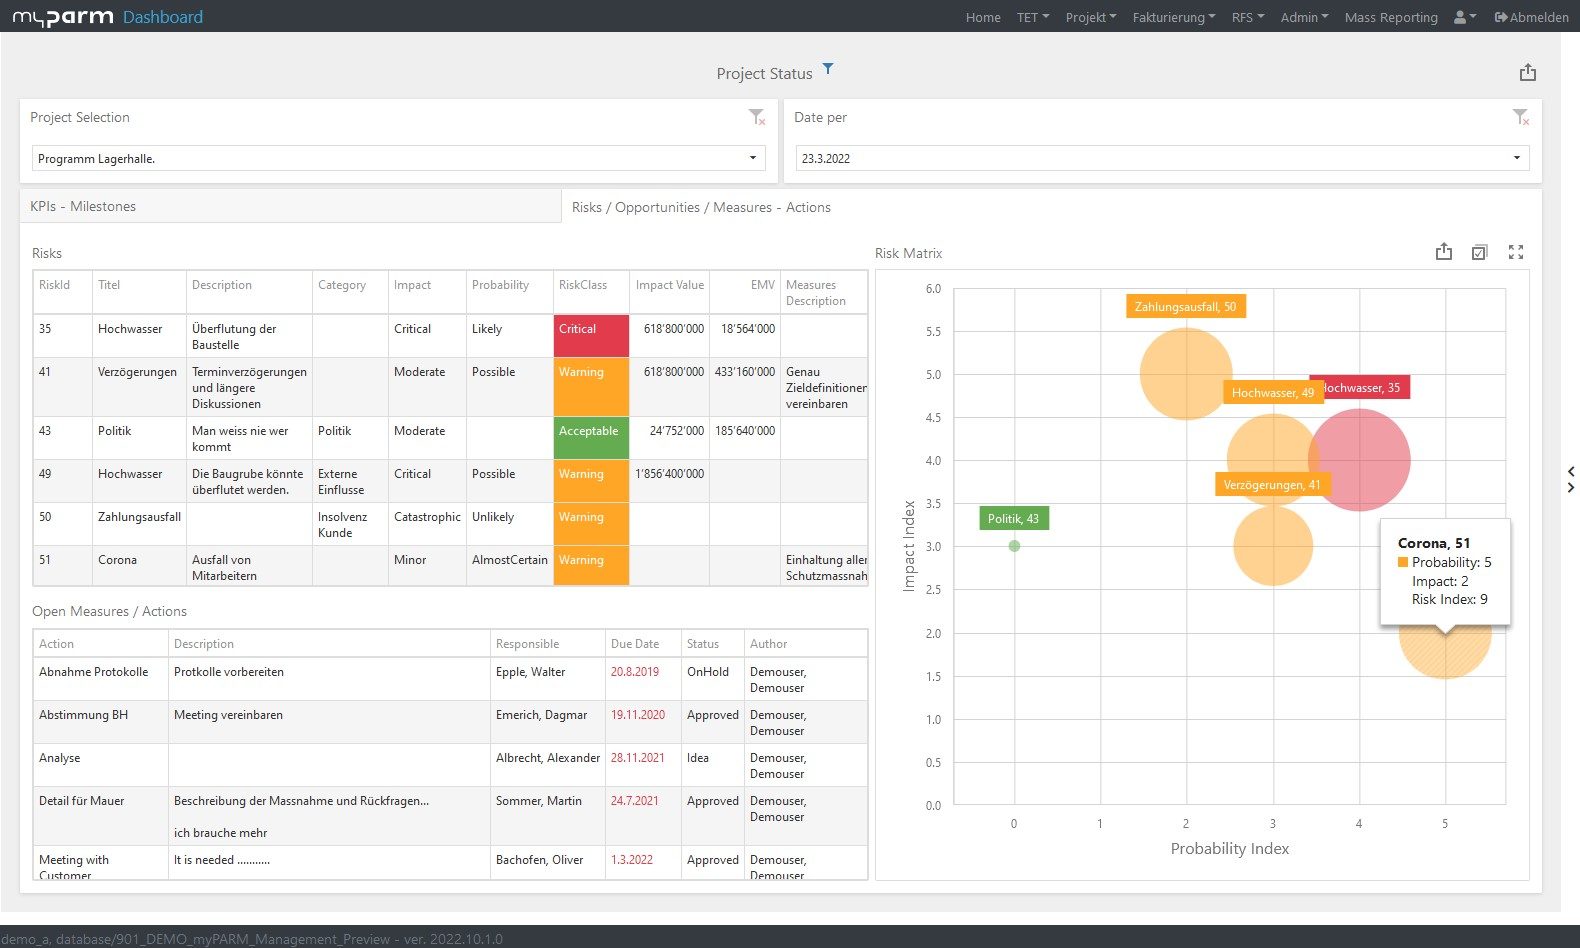
Hence, dashboards are nowadays at the heart of visual reporting. They provide a central place where various metrics and visualizations come together to paint a comprehensive picture of company performance. Such dashboards can be customized to the needs of different executives, delivering real-time insights without having to sift through pages of reports.
However, it’s crucial to choose chart types that best illustrate your data and direct viewers’ attention, enhancing data readability through design elements like colours and fonts.
5. Report structure and content
Reports can easily turn into a maze of numbers and facts, where orientation is quickly lost. Therefore, creating a clear and intuitive report structure is crucial. Starting with a concise summary and a clear outline, a good structure allows readers to navigate purposefully and find desired information quickly. Each section should logically build upon the next, establishing a clear link between different aspects of the report. For instance, you can start your report with a summary of key findings, followed by background information, trends, deviations, and recommendations. If you want to make your reports particularly engaging, Data Storytelling is an excellent method to weave a narrative around your data.
6. Embrace digital reporting and automation
In the past, paper reports were the norm. However, we recommend transitioning to digital reports due to their numerous advantages:
- Automated data integrations allow you to access real-time data at any time, enabling decisions based on current information.
- Reports can be automatically generated at defined intervals and made available to readers. This saves valuable time that can be used elsewhere.
- Digital dashboards can be made interactive. Report recipients can zoom in or out on data, obtaining the level of detail they need. They can also filter data to gain important insights. This makes digital dashboards highly versatile.
7. Regular review and adaptation
Business requirements are in constant flux. Hence, it’s important to regularly adjust your created reports. Review the report structure, its contents, and goals to ensure they still align with current needs and, thus, remain relevant. If circumstances change, such as your company’s strategy or business model, these changes should be reflected in your reports. Therefore, testing your reports at regular intervals to identify irrelevant data is recommended. Only by continuously improving your reports will they continue to provide relevant information in the future.
Conclusion
Implementing best practices in management reporting is crucial for making better business decisions as well as optimizing company performance. Through clear objectives, reliable data, appealing visualizations, and continuous adjustments, management gains all the necessary information to make informed decisions and drive the company’s success.
To successfully implement these practices, we recommend using modern Business Intelligence tools like myPARM BIact. Such tools can streamline the entire reporting process by collecting, analysing, and presenting data in meaningful reports from various sources. myPARM BIact offers user-friendly interfaces, extensive data visualization options, as well as real-time report generation. Furthermore, integrated controls facilitate collaboration between executives, teams, and departments. By utilizing BI software, you not only save time but also ensure that your management reports enable informed decisions based on up-to-date information.
Learn more about the Business Intelligence Software Software myPARM BIact:
Would you like to get to know myPARM BIact in a demo presentation? Then make an appointment with us right away!

