Gantt-Diagramm
So nutzen Sie das Gantt-Diagramm für einen klaren Überblick über Projekte

Ein Gantt-Diagramm ist eine der gängigsten und effektivsten Methoden, um Aufgaben, Arbeitspakete, Teilprojekte, Phasen oder Projekte bzw. Programme im Projektmanagement zeitbezogen darzustellen. Für die anfängliche Projektplanung wird in der Regel zunächst ein Projektstrukturplan verwendet. Da dieser aber weniger für die Termin- und Ablaufplanung geeignet ist, wird meist das Gantt-Diagramm verwendet.
Was ist ein Gantt-Diagramm?
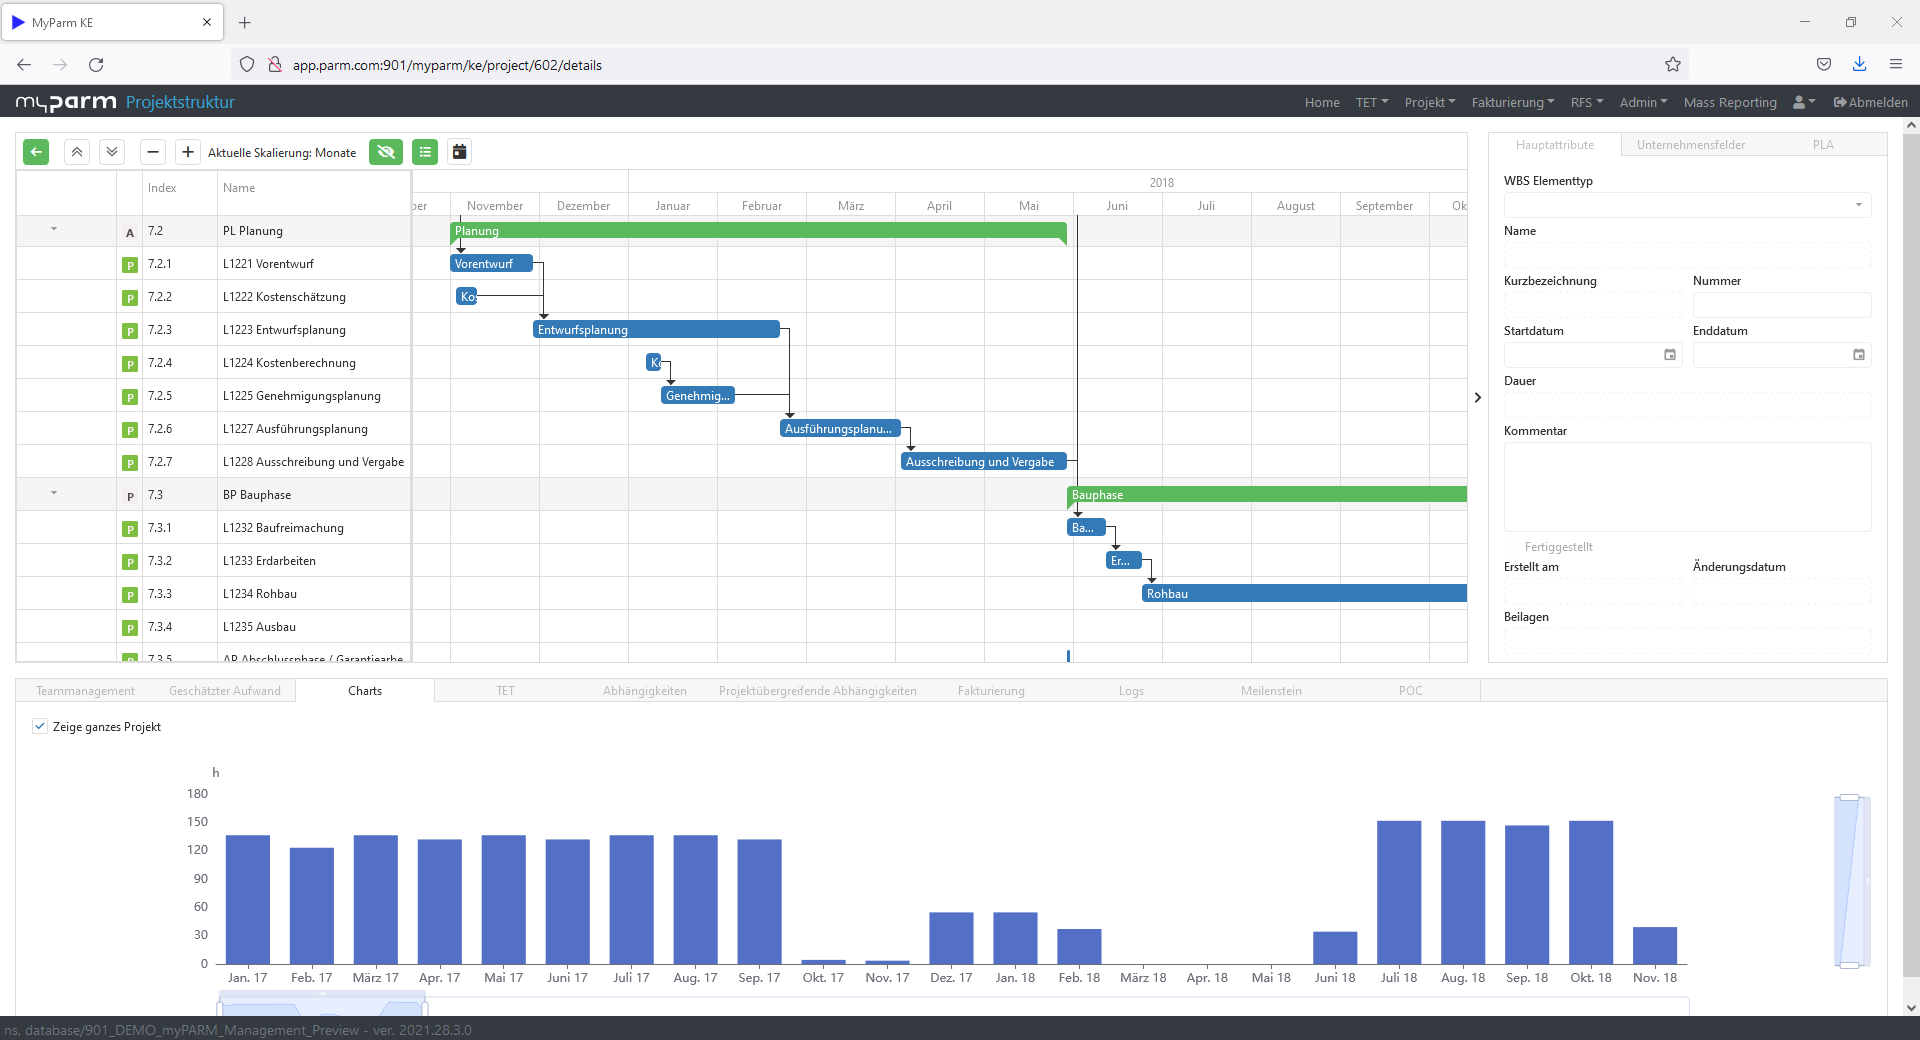
In einem Gantt-Diagramm werden alle geplanten Aufgaben eines Projektes in einer Übersicht als Diagramm dargestellt. Dabei befindet sich in der Regel links die Abbildung des Projektstrukturplans und rechts daneben werden die Aktivitäten durch Balken auf einer Zeitleiste dargestellt. Auf diese Weise ist für alle Beteiligten ersichtlich, welche Aufgaben wann erledigt werden müssen.
Das Gantt-Diagramm zeigt meistens:
- Start- und Enddatum eines Projekts
- Welche Aufgaben das Projekt umfasst
- Das geplante Anfangs- und Enddatum jeder Aufgabe
- Die geschätzte Dauer der Aufgabe
- Überschneidungen und Verknüpfungen der Aufgaben
- Wichtige Meilensteine im Verlauf des Projektes
- Pufferzeiten des Projektes
- Den kritischen Pfad
- Häufig werden auch die Verantwortlichen für die Aufgaben hinzugefügt
Die wichtigsten Elemente
- Datumsangaben: Start- und Enddatum des Projektes sind eines der wichtigsten Elemente des Gantt-Diagramms.
- Aufgaben: Durch die strukturierte Auflistung von Aufgaben und Teilaufgaben wird keine Aktivität vergessen, auch wenn es sich um komplexe Projekte handelt.
- Voraussichtlicher Zeitrahmen: Um sicher zu stellen, dass Aufgaben termingerecht erledigt werden und um während der Projektdurchführung einen Überblick über die Fertigstellung zu behalten, wird aufgeführt, wann jede Aufgabe ausgeführt werden sollte und wie lange die Ausführung dauert.
- Abhängigkeiten: Manche Aufgaben können zu beliebigen Zeitpunkten parallel zu anderen Aufgaben ausgeführt werden. Die Ausführung anderer Aufgaben ist aus inhaltlichen oder technischen Gründen voneinander abhängig. Diese Beziehungen werden im Gantt-Diagramm ebenfalls dargestellt. Es gibt verschiedene Arten von Abhängigkeiten:
- Ende-Anfang-Beziehung (Normalfolge): Wenn der vorangehende Vorgang endet, kann der nachfolgende Vorgang beginnen.
- Anfang-Anfang-Beziehung (Anfangsfolge): Der nachfolgende Vorgang kann begonnen werden, sobald mit dem vorgehenden Vorgang angefangen wurde.
- Ende-Ende-Beziehung (Endfolge): Der Nachfolger kann beendet werden, sobald der Vorgänger beendet wurde.
- Anfang-Ende-Beziehung (Sprungfolge): Der nachfolgende Vorgang kann nicht beendet werden, wenn der vorgehende Vorgang noch nicht begonnen wurde.
- Fortschritt: Um zu sehen, wie sich ein Projekt entwickelt und welche Aufgaben bereits abgeschlossen sind, werden die Balken häufig eingefärbt.
- Aktuelles Datum: Eine vertikale Linie, die sich über das gesamte Gantt-Diagramm zieht, markiert in aller Regel das aktuelle Datum.
- Meilensteine: Meilensteine stehen für Etappenziele und Schlüsselmomente Ihres Projektes.
So erstellen Sie ein Gantt-Diagramm
Als Grundlage des Gantt-Diagramms können Sie den Projektstrukturplan verwenden, denn Sie benötigen eine Liste mit allen Sammelaktivitäten und Aufgaben des Projektes sowie einen festgelegten Zeitrahmen. Ausserdem sollten Sie die Abhängigkeiten zwischen den einzelnen Aufgaben notieren. Mit diesen Informationen können Sie ein Gantt-Diagramm erstellen – ganz unabhängig davon, ob Sie die Daten von Hand auf Papier übertragen, ein Diagramm in Excel erstellen oder eine Projektmanagement-Software dafür nutzen. Tragen Sie links Aufgaben, Arbeitspakete, Teilprojekte, Phasen oder Projekte bzw. Programme ein und notieren Sie rechts ihre Start- und Endpunkte, ihre Dauer sowie Abhängigkeiten auf einem Zeitstrahl.
So könnte Ihr Gantt-Diagramm aussehen:

Vorteile
- Klare Projektübersicht
Ein grosser Vorteil des Gantt-Diagramms ist die übersichtliche Darstellung, den es bietet. Die zeitliche Planung ist so leicht verständlich und auch während der Umsetzung des Projektes sieht man jederzeit, wie weit das Projekt fortgeschritten ist sowie welche Aufgaben als nächstes anstehen. - Zielgerichtete Kommunikation
Da der Projektstatus sowie die aktuellen Aufgaben stets angezeigt werden, können Mitarbeitende sich leicht organisieren. Ausserdem kann das Gantt-Chart verwendet werden, um Stakeholder über den Projektfortschritt zu informieren. - Ermittlung von Zeitrahmen und Arbeitspensum
Gantt-Diagramme helfen, realistische Fristen und Puffer festzulegen und so Projekte besser zu planen. Ausserdem können Sie mit Hilfe des Gantt-Diagramms ermitteln, wie viel Personal sie benötigen, Ressourcen zuweisen und Fälligkeitsdaten anhand der verfügbaren Ressourcen planen. - Organisation komplexer Projekte
Auch komplexe Projekte können in Gantt-Diagrammen übersichtlich dargestellt werden. - Flexibilität
Häufig kommt es während der Projektlaufzeit zu Verzögerungen oder Änderungen. Das Gantt-Diagramm ist flexibel an solche Änderungen anpassbar. - Motivation der Mitarbeitenden
Durch den klaren Überblick erhalten alle Teammitglieder einen guten Einblick in die Projektleistung. So können sie ihre Arbeitsweise an den Plan anpassen. Durch die Verknüpfung und Abhängigkeiten der Aufgaben können sie verstehen, was die Verzögerung einer Aufgabe für das Projekt bedeutet. Dies führt häufig zu einer besseren Zusammenarbeit und Koordination.
Nachteile
- Schwierigkeiten bei steigender Komplexität
Bei grossen Projekten mit vielen Aufgaben kann das Gantt-Diagramm unübersichtlich werden. In diesem Fall ist es wichtig, die Aufgaben in sinnvolle Sammelaktivitäten zu gruppieren und in Teilaufgaben einzuteilen. - Linearität erforderlich
Das Gantt-Diagramm ist nur nützlich, wenn das Projekt linear abläuft. Das bedeutet, dass schon zu Projektstart ein klares Endergebnis festgelegt sein sollte und die nötigen Schritte, um das Ergebnis zu erreichen, klar sein sollten. Bei Aufgaben ohne spezifisches Ziel, wie beispielsweise beim agilen Projektmanagement, sind andere Aufgaben der Projektplanung sinnvoller, wie z. B. Kanban-Boards. - Arbeitsaufwand
Ein Gantt-Diagramm für grosse Projekte anzulegen ist zunächst ein relativ grosser Aufwand. Muss die Projektplanung dann noch an Veränderungen angepasst werden kann die Pflege von Gantt-Diagrammen viel Zeit in Anspruch nehmen. Eine moderne Projektmanagement-Software erleichtert Ihnen nicht nur die Pflege Ihrer Gantt-Diagramme, sondern hilft Ihnen mit Best-Practice-Vorlagen oder individuell angepassten Projektvorlagen beim Anlegen der Projekte.
Besonderheit: Multi-Projekt-Gantt
Projektmanager sind häufig nicht nur für ein einziges Projekt verantwortlich, sondern arbeiten gleichzeitig an mehreren verschiedenen Projekten. Da es auch zwischen diesen Projekten Abhängigkeiten geben kann, ist ein einfacher Weg, sie alle gleichzeitig darzustellen, das Multi-Projekt-Gantt-Diagramm. Auf diese Weise können Sie den aktuellen Stand und die wichtigsten Meilensteine mehrerer Projekte gleichzeitig überblicken. Sie können die Aufgabenliste und Abhängigkeiten überprüfen und so den Arbeitsaufwand visualisieren, damit Sie besser planen können. Ausserdem können Sie auf diese Weise verschiedene Projekte untereinander priorisieren und dabei jederzeit den Zeitrahmen und den kritischen Pfad der Projekte im Blick behalten.

Fazit
Das Gantt-Diagramm ist zu Recht eine der bekanntesten Projektplanungs-Methoden. Es ermöglicht Projektmitgliedern, Zusammenhänge zwischen einzelnen Aufgaben zu verstehen, die Zeitplanung zu verbessern und das Projekt an Änderungen anzupassen. Aufgrund seiner Darstellungsform sind Gantt-Diagramme insbesondere für Projekte mit vielen parallelen und voneinander abhängigen Aufgaben geeignet.
Mit einer Projektmanagementsoftware können Sie Gantt-Diagramme einfach und schnell erstellen, beipsielsweise mit individuellen Vorlagen oder Best Practice Beispielen.
Erfahren Sie mehr über die Projektmanagementsoftware myPARM:
Sie möchten myPARM in einer Demovorführung kennenlernen? Dann vereinbaren Sie gleich einen Termin mit uns!
