Project management ABC: M for Milestone (trend analysis)
Checking and assessing the adherence to deadlines of a project

Despite intensive planning and good preparation, it can happen that a project is delayed. In such a case, it is important to recognise the delay as quickly as possible in order to be able to react to it. Milestones and milestone trend analysis help project managers to check and assess whether a project is on schedule. Parm AG explains how this works and what you need to bear in mind.
What is a milestone?
Milestone is a typical term from classic project management. Milestones hardly exist in agile projects, whereas they are often used in hybrid projects.
A milestone marks important points in the project where a special event (e.g. the start of the project) takes place, a defined goal is achieved (e.g. project completion) or a result has been worked out (e.g. when a decision is to be made on the further course of action after a result is achieved). Often they also serve as test or measurement points and are therefore defined at the end of project phases.
Example:

In the example above you see the implementation of a software with a previous pilot phase. In addition to the “Kick-Off Workshop”, which defines the start of the project, you will find the milestone “Go / No-Go Decision”, at which it is decided whether to continue with the implementation of the software after the pilot phase has been carried out. If the implementation is to continue, this milestone also marks the “kick-off workshop”, or the start of the new project phase, the actual implementation. After the implementation has been completed, another milestone is reached with “system acceptance, start of operation” before the operational phase is started.
Why are milestones important?
- Structure: Milestones give structure to a project. Every member of the project team knows which points have to be completed in order to bring the project to a successful result. In this way they also have a motivating effect on the project team.
- Project control: Milestones help to assess the timeliness of a project. If a milestone is reached at the planned time, your project is on track. However, if it becomes apparent that a milestone will not be reached on time, you can check why this is the case and what impact it will have on further project phases. This will enable you to respond to the delay.
- Decision points: Milestones can serve as decision points, for example, when at a certain point in the project it has to be decided whether or how it will be continued. A milestone can therefore mark a point at which the further course of the project is rescheduled, alternatives are chosen and approvals are given.
- Quality assurance: By setting milestones, it is also possible to check regularly during the course of the project whether the results achieved are in accordance with the specifications.
What should be considered when setting milestones?
- Duration: A milestone should only serve as a checkpoint. Therefore, it has no duration.
- Wording: Since imprecise wording can lead to misunderstandings, you should pay attention to how you name the milestones. It should be clear what exactly is to be achieved at this point in time and what a proof for this looks like. For example, the milestone “kick-off completed” can be evidenced by minutes of the meeting.
- Number: Usually there is at least one milestone for the project start and one each for completed project phases. But it may be useful to define more milestones. Therefore, a project can have as many milestones as you consider useful. Still, you shouldn’t use too many milestones – not every task needs to be completed with a milestone as otherwise the many milestones could slow down the project.
What is Milestone Trend Analysis?
Milestone trend analysis (MTA) is a method for checking and monitoring the adherence to a projects deadlines. Here, at predefined reporting times of a project, it is queried for each milestone when it can be achieved or whether it has already been achieved. This data is transferred to a diagram so that the course of the forecast lines shows whether a project can probably be completed on schedule.
Process and structure of the MTA
1. Definition of milestones and reporting dates
A prerequisite for the MTA is, on the one hand, clearly defined milestones with fixed dates. On the other hand, the reporting dates, i.e. the key dates on which a review of the milestones is to take place, must also be determined. This is usually done before the start of the project or before the beginning of a new project phase.
2. Create an MTA diagram
Now a diagram is created.
- On the x-axis (horizontal) enter the reporting dates.
- On the y-axis (vertical) enter the planned dates of the milestones.
3. Assess the situation at the time of the report
At the defined reporting dates, it is now clarified by which date each milestone can probably be achieved. Often this assessment takes place in a meeting in which, if possible, all team members who are responsible for a milestone take part.
Clarify the following questions:
- Which milestones have already been achieved?
- Have there been any difficulties or problems since the last reporting date?
- Have any problems that existed at the previous reporting date been solved in the meantime?
- What work still needs to be done to reach a milestone?
- Does the forecast date of the milestone need to be postponed? If so, what is the new date?
This predicted deadline is then transferred to the chart at the time of the report.
4. Interpretation of the results
After a few reporting dates, a trend emerges from the different dates for each milestone. The project manager now has the task of interpreting this trend.

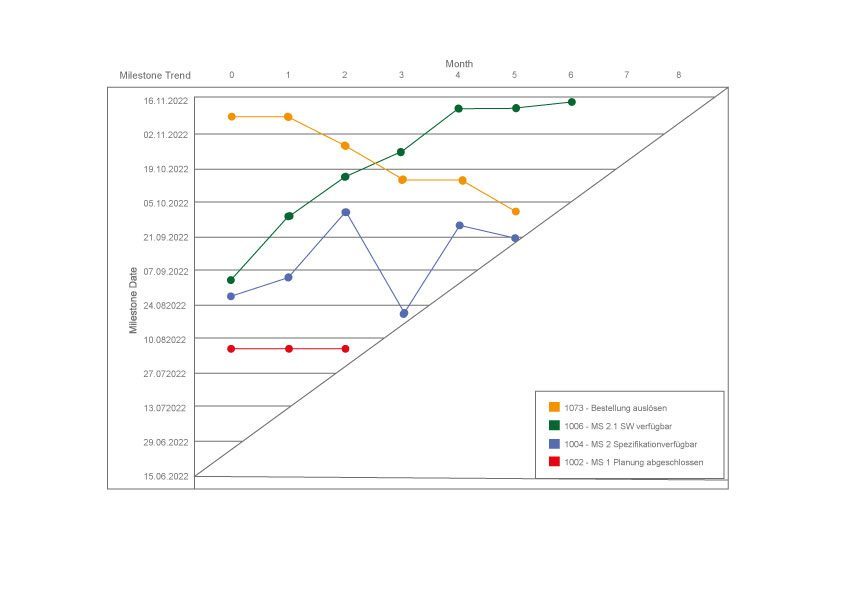
In the example above, these basic interpretations are possible:
- The red line shows a milestone for which the forecast date has not shifted in the course of the project. The milestone was reached according to plan.
- The zig-zag course of the blue line shows that a date was frequently rescheduled. This indicates that there was generally a great deal of uncertainty in the appointment statements. Therefore, the deadline had to be moved forwards and backwards several times. If an appointment was initially moved back, but then moved forward again, this also indicates that problems were identified at a reporting date and were subsequently solved by countermeasures.
- The strongly rising course of the green line shows that the deadline was initially planned too optimistically and therefore cannot be met. In addition, problems or difficulties may have arisen here that cause the date to be pushed back further and further. This can be the loss of important resources, a task that turns out to be much more complex than planned, or delivery bottlenecks of a supplier.
- The opposite is the case with the yellow line: the ever falling course indicates that the planning was made too pessimistically and with too large buffers. The cancellation of tasks, a faster delivery or even a task that was easier than expected can be reasons for this. Therefore, this milestone is reached much earlier than planned. What sounds very good at first also has a negative side, as for example resources could not be optimally planned in advance and distributed to other tasks.
- Distance between the lines: In addition to the actual trends of the milestones, the distance between the milestones can also be interpreted. If the distance becomes smaller, the time available between the milestones shortens. This is particularly important if individual milestones are interdependent.
- Combination of several lines:
- If it becomes apparent that all or most of the milestones have to be moved backwards at the same time, this should be questioned urgently, because in this case there are probably difficulties with the project team. Be it that the project itself was not given the necessary priority, there are disputes or lack of clarity in the team or the deadlines are generally not accepted. A precise analysis is necessary here in order to take countermeasures.
- If the deadlines initially remain the same, but as their completion date approaches they are pushed further and further back, the project is also in crisis and perhaps no one feels responsible for meeting the deadlines. In this case, resources may be wasted unnecessarily and it may make sense to abandon the project altogether.
Advantages of the MTA
- Simple early warning system for delays in projects
- Progress in the project can be monitored transparently
- Intuitive method that is easy to implement
- Realistic forecast of future project progress possible
- Fast reaction to problems and difficulties possible
- Good communication tool
Disadvantages of the MTA
- The milestone trend analysis does not show dependencies between individual milestones. In particular, the critical path, which determines the deadline delay of the whole project, is not shown in the MTA.
- The interpretation of the milestone trend analysis is subjective and depends on the experience of the project manager. Therefore, the MTA is good for gaining a quick overview. However, if the interpretation is to be worked with, it should be commented on.
- Milestones bear the danger of being used wastefully and of being set up purely for controlling purposes. In that case, they can slow down the progress of the project.
Areas of application
Milestone trend analyses provide a good overview of the project’s adherence to schedules. They are therefore often used in status reports, which present the current status of a project in a very condensed way. For example, they can be used to inform clients or superiors. At the same time, the MTA can be used to keep all team members up to date beyond their own tasks, especially in large projects. In addition, an MTA should not be missing from any project completion report, where it not only illustrates the earliest recognition of schedule delays, but also makes it possible to talk about the countermeasures introduced and their effects within the framework of lessons learned.
Conclusion
Milestones and milestone trend analysis can be important instruments in project controlling. They not only provide a quick overview of a project’s adherence to schedules. Project managers with a lot of experience in particular can interpret the course of the milestone trend analysis and thus gain important insights for the further course of the project and derive measures.
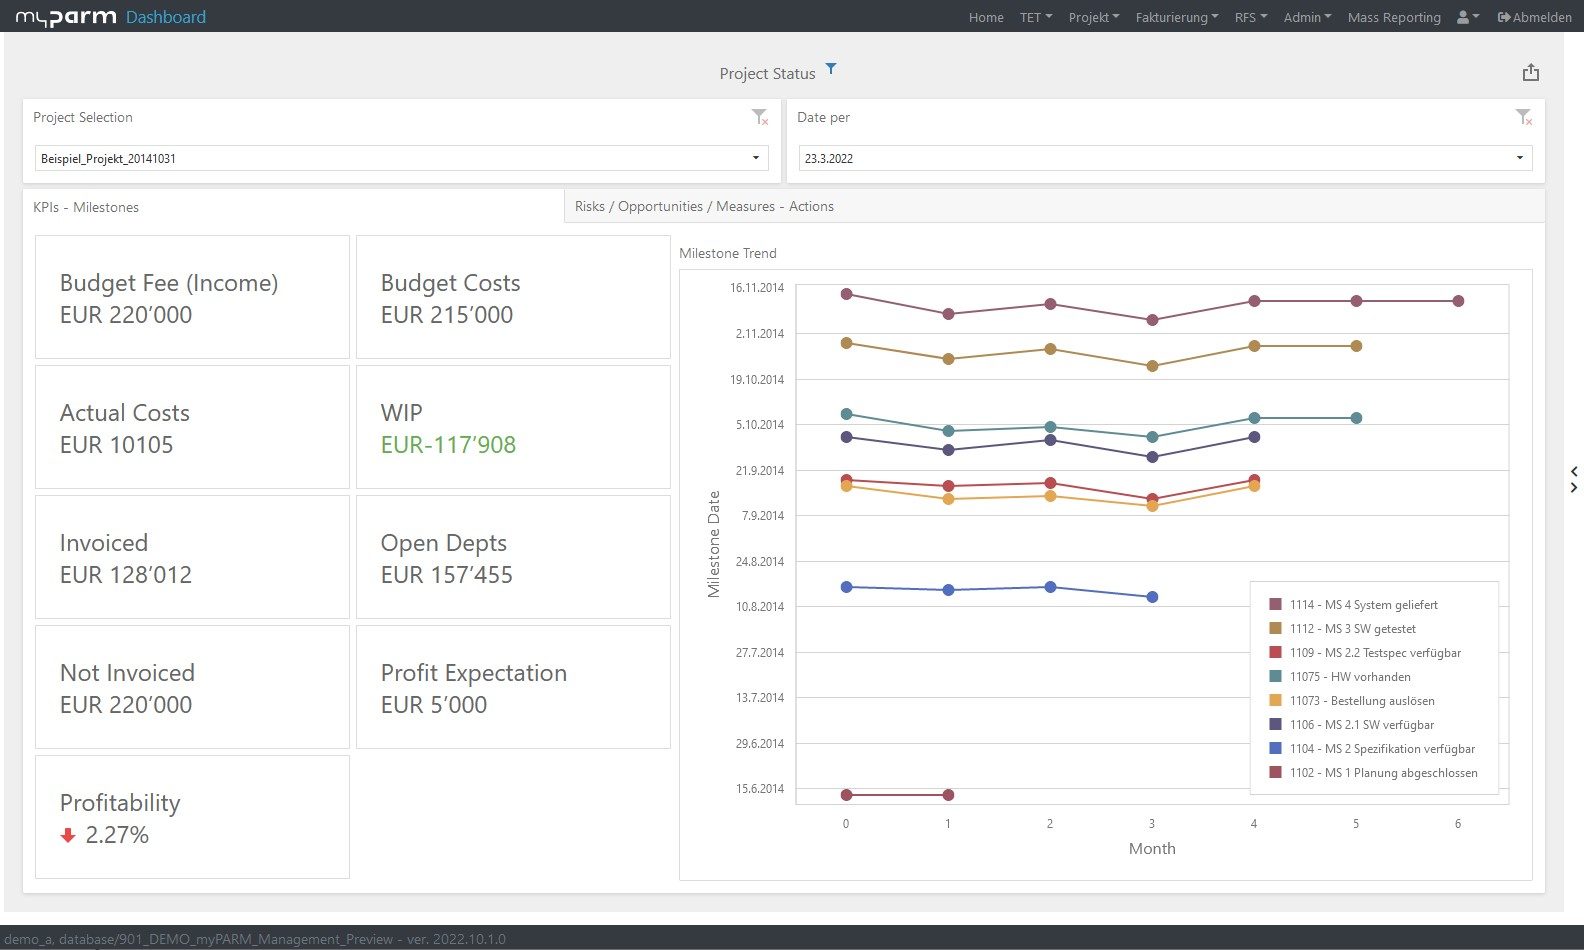
The milestone trend analysis is easy to use and intuitively understandable. However, it becomes even easier when a project management software takes it over. This way you have an overview of the current forecasts in a dashboard at any time and can initiate measures directly in the same system.
More about the project management software myPARM:
Would you like to get to know myPARM in a demo presentation? Then make an appointment with us right away!

